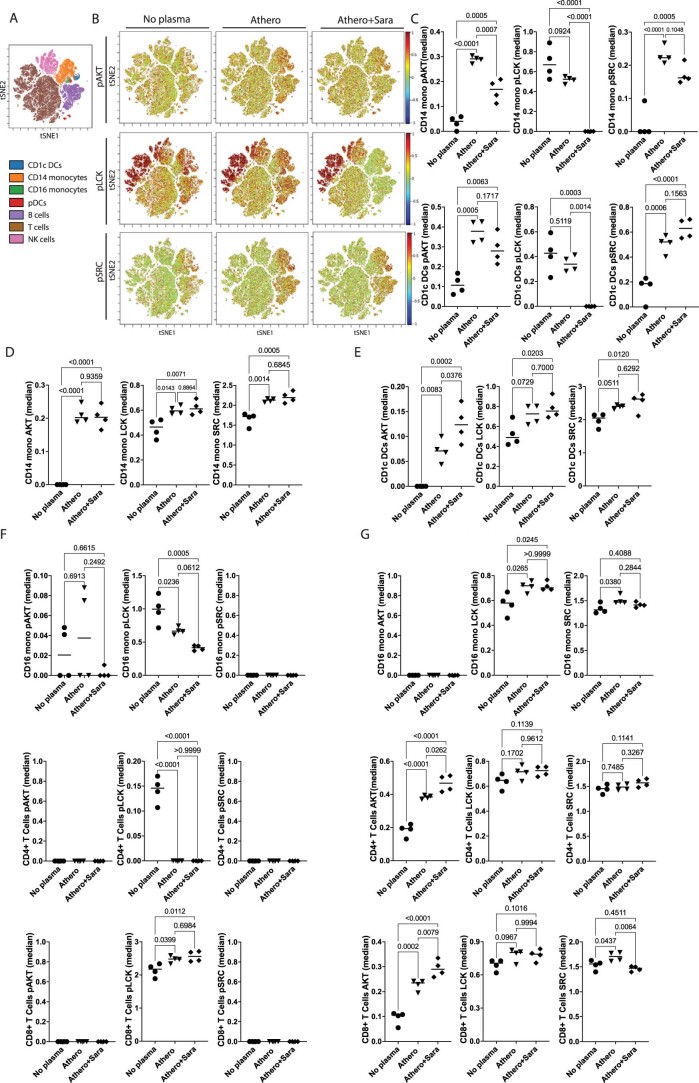
Extended Data Fig. 8. Saracatinib altered the signaling induced by athero plasma by reducing the activation of SRC, LCK and PI3K/Akt/mTOR signaling.
A. viSNE plot of major cell types in healthy PBMC defined based on canonical expression patterns. B. The phosphorylation signaling of AKT, LCK, SRC was visualized across this immune map in response to atheroplasma (athero) vs atheroplasma + saracatinib 10 µM (athero+sara), or no stimulation (no plasma); n = 4 biologically independent samples/condition, males=1. C. Dot plots show the effect of atheroplasma (athero) vs atheroplasma + saracatinib 10 µM (athero+sara), or no stimulation (no plasma) on the phosphorylation of AKT, LCK, SRC in CD14+ monocytes and CD1c+ DCs, n = 4 biologically independent samples/condition, males=1. P values were determined by one-way ANOVA with Tukey’s post hoc test across all groups. D. Dot plots show the effect of atheroplasma (athero) vs atheroplasma + saracatinib 10 µM (athero+sara), or no stimulation (no plasma) on protein levels of AKT, LCK, SRC in CD14+ monocytes; n = 4 biologically independent samples/condition, males=1. P values were determined by one-way ANOVA with Tukey’s post hoc test across all groups. E. Dot plots show the effect of atheroplasma (athero) vs atheroplasma + saracatinib 10 µM (athero+sara), or no stimulation (no plasma) on total protein levels of AKT, LCK, SRC in CD1c+ DCs; n = 4 biologically independent samples/condition, males=1. P values were determined by one-way ANOVA with Tukey’s post hoc test across all groups. F. Dot plots show the effect of atheroplasma (athero) vs atherosplasma + saracatinib 10 µM (athero+sara), or no stimulation (no plasma) on phosphorylation and total protein levels of AKT, LCK, SRC in CD16+ monocytes, CD4 + T cells, CD8 + T cells; n = 4 biologically independent samples/condition, males=1. P values were determined by one-way ANOVA with Tukey’s post hoc test across all groups. G. Dot plots show the effect of atheroplasma (athero) vs atheroplasma + saracatinib 10 µM (athero+sara), or no stimulation (no plasma) on total protein levels of AKT, LCK, SRC in CD16+ monocytes, CD4 + T cells, CD8 + T cells; n = 4 biologically independent samples/condition, males=1. P values were determined by one-way ANOVA with Tukey’s post hoc test across all groups.

