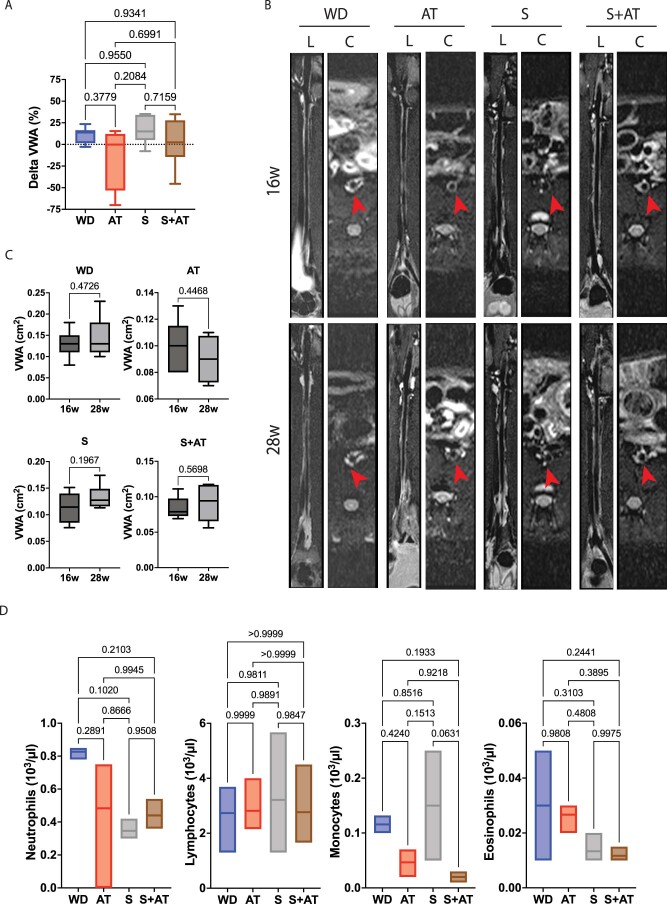
Extended Data Fig. 10. Effect of Saracatinib in a Rabbit Model of Advanced Atherosclerosis.
A. Changes in vessel wall area (VWA, cm2) between 16 weeks and 28 weeks measured as the percentage of the difference between outer and inner wall area (delta VWA %) in each treatment group, WD: n = 7; AT: n = 4; S12.5: n = 6; S12.5 + AT: n = 6. One-way ANOVA with Tukey’s post hoc test across all groups. Box plots showing the mean and range (min to max). B. Representative cross-sectional MRI images of rabbit aortas for each group at 16 and 28 weeks (L=longitudinal sections; C=cortical sections) Red arrows indicate the aorta position. C. Pre-treatment (16 weeks) and post-treatment (28 weeks) vessel wall area (VWA, cm2) in each treatment group. P values were determined by unpaired two-tailed t-test. D. Bar graphs of complete blood count (CBC) for each group measuring the concentration of neutrophils, lymphocytes, monocytes and eosinophils (103/ul) at 28 weeks, n = 3 rabbits/group. Floating bars showing the mean and range (min to max). P values were determined by one-way ANOVA with Tukey’s post hoc test across all groups.

