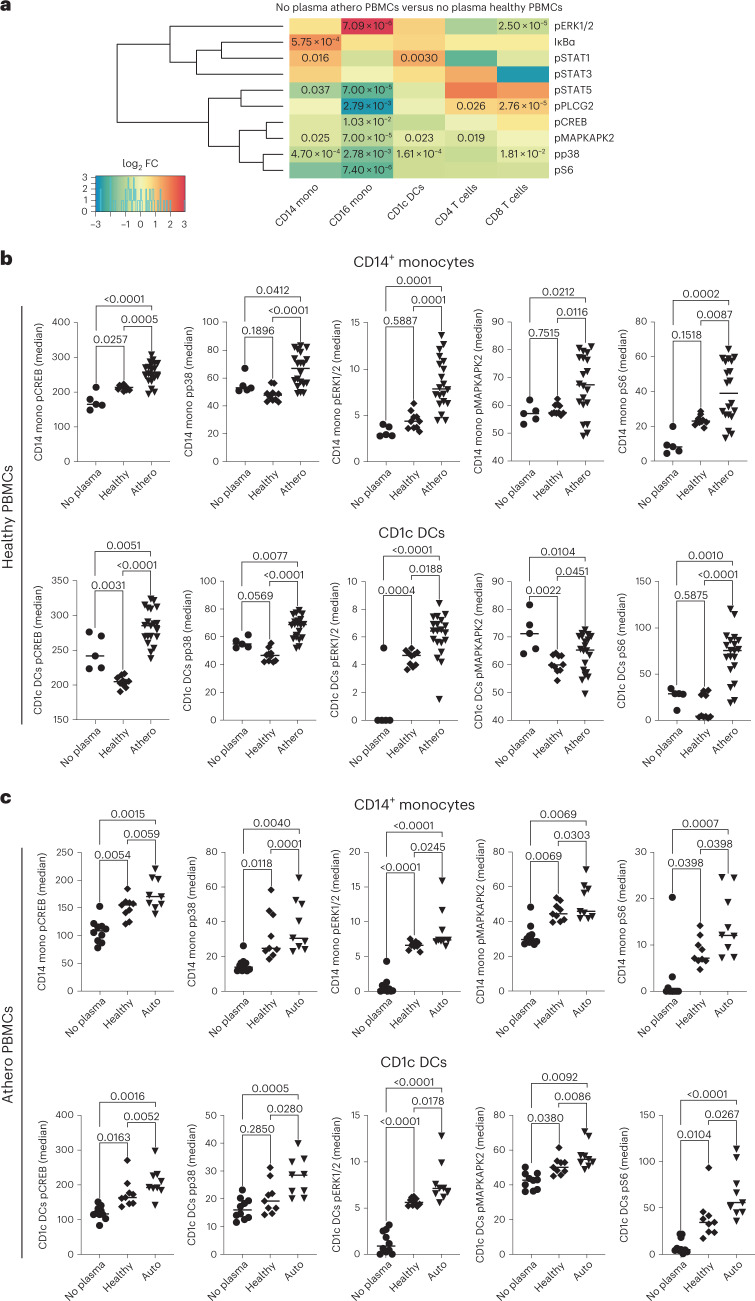
Fig. 3. Single-cell mass cytometry reveals distinct resting and stimulated immune responses in PBMCs from patients with atherosclerosis and healthy donors.
a, Heat map of mass cytometry data, ordered by immune cell types, highlights the activation of specific intracellular markers in unstimulated PBMCs from patients with atherosclerosis (no plasma athero PBMCs; n = 10 biologically independent samples, 5 men) versus unstimulated PBMCs from healthy donors (no plasma healthy PBMCs; n = 5 biologically independent samples). Clustering was based on standardized z-scores of median phosphoprotein values with absolute log2 FC > 0 considered upregulated with respect to healthy donors. Unpaired two-tailed t-test was used for significance. The Benjamini–Hochberg method was used for multiple correction (FDR < 0.05) and adjusted P values <0.05 were considered significant. b, Dot plots show the effect in PBMCs from healthy donors of atherosclerotic plasma (n = 20 biologically independent samples, 10 men) versus healthy plasma (n = 10 biologically independent samples) or no stimulation (no plasma; n = 5 biologically independent samples) on the phosphorylation of intracellular kinases in CD14+ monocytes and CD1c+ DCs. P values were determined by one-way ANOVA with Tukey’s post hoc test across all groups. c, Dot plots show the effect in PBMCs from autogolous plasma from patients with atherosclerosis (n = 9 biologically independent samples, 5 males) versus healthy plasma (n = 9 biologically independent samples) or no stimulation (n = 10 biologically independent samples, 5 men) on the phosphorylation of intracellular kinases in CD14+ monocytes and CD1c+ DCs. P values were determined by one-way ANOVA with Tukey’s post hoc test across all groups.

