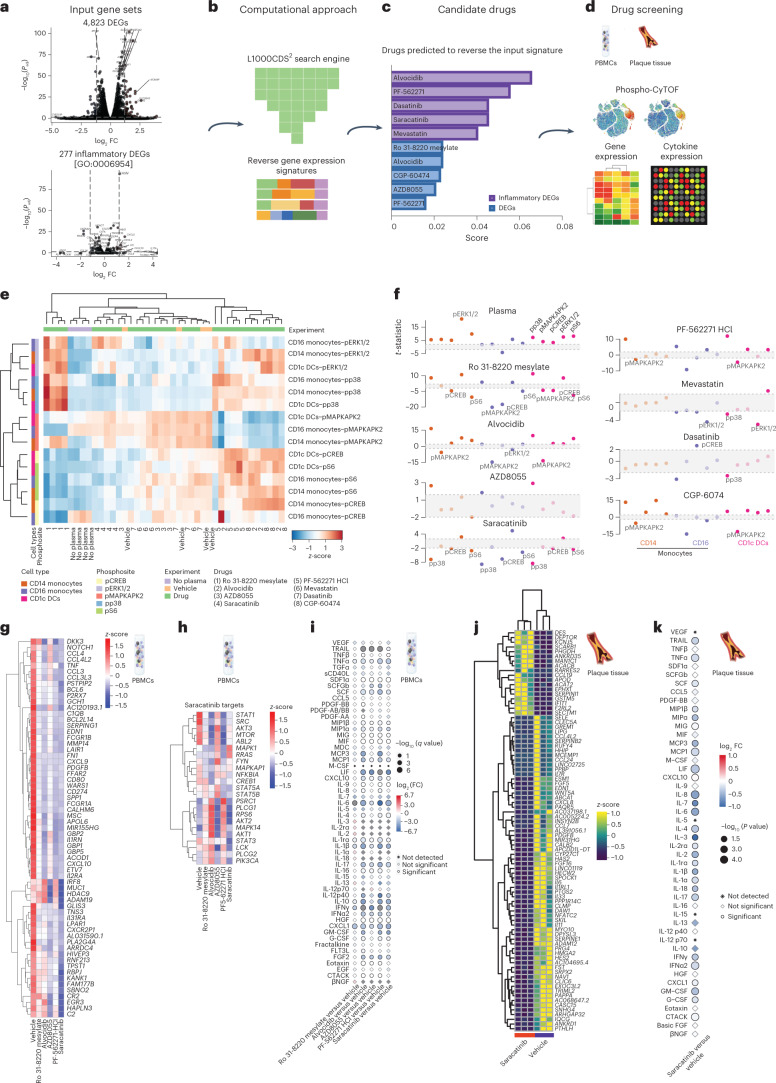
Fig. 6. Drug repurposing computational pipeline to identify candidate anti-inflammatory small molecules for atherosclerotic disease and ex vivo screening approach.
a, Input gene set signatures consisting of 4,823 DEGs and 277 inflammatory (GO:0006954) DEGs in healthy PBMCs, in response to atherosclerotic plasma. b, LINCS L1000CDS2 search engine used to identify drugs predicted to reverse the input transcriptional signatures. This figure was created with Biorender.com. c, Candidate drugs predicted to reverse the two gene set input signatures in healthy PBMCs, in response to atherosclerotic plasma. d, Drug screening was based on the integrated analysis of phospho-CyTOF screens, gene expression analysis and cytokine secretion by PBMCs and plaques in response to atherosclerotic plasma in the presence or the absence of candidate drugs in healthy PBMCs, in response to atherosclerotic plasma. e, Single-cell phosphorylation measured by CyTOF in CD1c+ DCs and CD14+ and CD16+ monocytes from PBMCs stimulated with atherosclerotic plasma alone (plasma) or in combination with individual top candidate small molecules (1–8), n = 4 biologically independent samples/condition. f, t-Statistics of monocyte- and DC-specific phosphorylation, with positive values indicating upregulation and negative values downregulation. Plasma response is compared with no plasma treatment. Each small molecule combined with plasma treatment is compared with plasma treatment alone. Points outside the gray box indicate significance (P < 0.05, d.f. = 6), n = 4 biologically independent samples per condition (2 men). g, Heat map of DEGs showing the z-scores of transcripts with absolute log2 FC > 0 and q value (adjusted p value) <0.05 in PBMCs in response to candidate drugs plus atherosclerotic plasma versus atherosclerotic plasma alone (vehicle), n = 4 biologically independent samples per condition (2 men). h, Heat map of saracatinib target and phosphosignaling genes showing the z-scores of transcripts in PBMCs in response to candidate drugs plus atherosclerotic plasma versus atherosclerotic plasma alone (vehicle), n = 4 biologically independent samples/condition (2 men). i, Point plot of PBMC cytokines secreted in response to candidate drugs plus atherosclerotic plasma (n = 4 biologically independent samples per condition, 2 men) versus atherosclerotic plasma alone (vehicle, n = 4 biologically independent samples per condition, 2 men). P values were determined by paired two-tailed t-test. Adjusted P values were considered significant. The Benjamini–Hochberg method was used to correct for multiple correction (FDR < 0.05). j, Heat map of DEGs showing the z-scores of transcripts with absolute log2 FC > 1.2 and q value <0.001 in atherosclerotic tissue in response to saracatinib plus atherosclerotic plasma (saracatinib) versus atherosclerotic plasma alone (vehicle), n = 3 samples per condition. k, Point plot of cytokines secreted by atherosclerotic tissue in response to saracatinib plus atherosclerotic plasma (saracatinib) versus atherosclerotic plasma alone (vehicle), n = 3 biological samples per condition. P values were determined by unpaired t-test. Illustrations of representative heat maps in d and representative PBMC tubes and arteries in g–k were created in Biorender.com.

