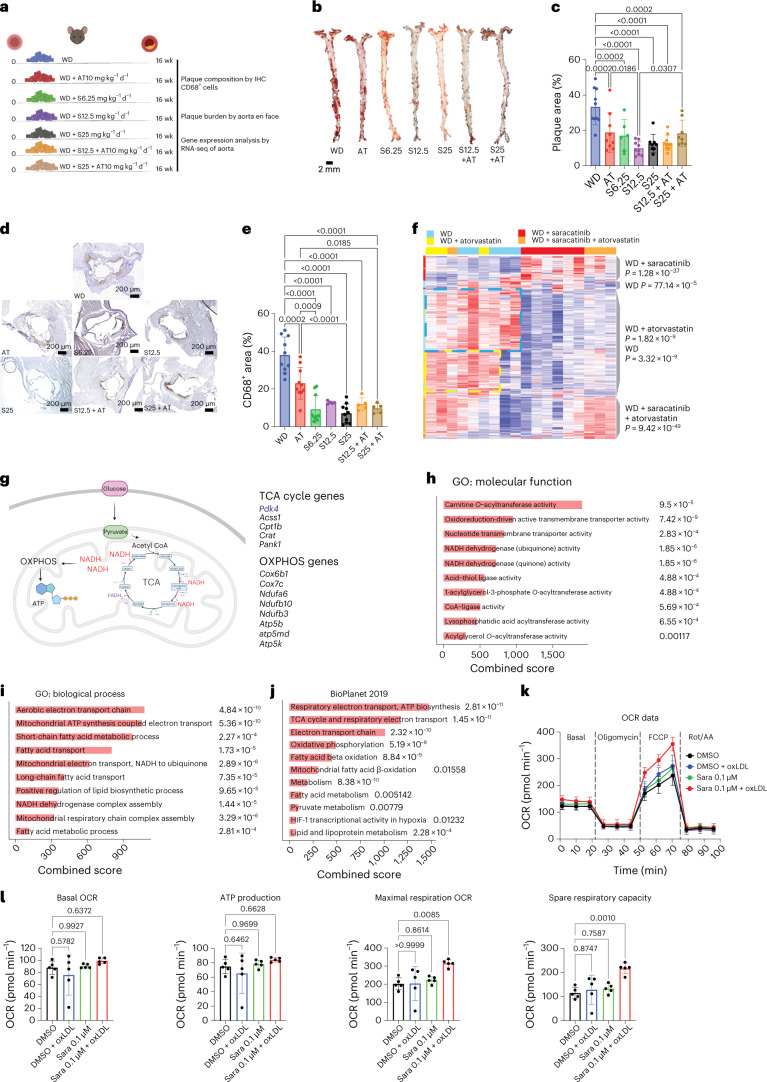
Fig. 7. Effect of saracatinib on atherosclerosis in vivo.
a, Experimental design to study the effect of saracatinib 6.25 (S6.25), 12.5 (S12.5) or 25 (S25) mg kg−1 d−1; atorvastatin (AT; 10 mg kg−1 d−1); or the combination of saracatinib and atorvastatin (S + AT; 12.5 or 25 and 10 mg kg−1 d−1) admixed to WD on plaque burden, composition and gene expression compared with WD alone in male Apoe−/− mice. This figure was created with Biorender.com. b, Representative images of en face preparation of aortas stained with ORO. c, Bar graphs with overlapping dots of en face ORO+ area quantification (plaque area). WD, n = 10; AT, n = 9; S6.25, n = 6; S12.5, n = 9; S25, n = 8; S12.5 + AT, n = 10; S25 + AT, n = 8 mice. P values were determined by one-way ANOVA with Tukey’s post hoc test across all groups. d, Representative images of CD68 immunostaining of the aortic root (4× magnification). e, Bar graphs with overlapping dots of CD68+ area quantification. WD, n = 10; AT, n = 10; S6.25, n = 10; S12.5, n = 5; S25, n = 10; S12.5 + AT, n = 5; S25 + AT, n = 5 mice. P values were determined by one-way ANOVA with Tukey’s post hoc test. Data are presented as mean ± s.d. f, Heat map of the top 100 DEGs hierarchically clustered expressed in the aortas across treated mice. WD, n = 5; AT, n = 3; S, n = 6; S + AT, n = 4 mice. Rows, z-scored gene expression values; columns, individual aortas. The treatment categories are indicated above the heat map and the dendrograms on the right indicate the DEGs enriched in the different categories. P values were determined by the two-sided binomial proportions test. g, Top DEGs involved in the TCA cycle and OXPHOS induced by saracatinib in the aortas of treated mice, n = 6. This figure was created with Biorender.com. h, GO molecular functions of the top 100 DEGs upregulated in the saracatinib group, n = 6 mice. The combined score (c) was calculated from the P value obtained using Fisher’s exact test. i, GO Biological Process of the top 100 DEGs upregulated in the saracatinib group, n = 6 mice. The combined score was calculated from the P value obtained using Fisher’s exact test. j, BioPlanet signaling pathway analysis of the top 100 DEGs upregulated in the saracatinib group, n = 6 mice. The combined score was calculated from the P value obtained using Fisher’s exact test. k, OCR and respiratory parameters in mouse BMDMs treated with vehicle (dimethylsulfoxide (DMSO), n = 5 biologically independent samples), DMSO + oxLDL (n = 4 biologically independent samples), 0.1 µM saracatinib (sara) or 0.1 µM saracatinib + oxLDL (n = 5 biologically independent samples/condition). Data are presented as mean ± s.d. l, Summary of respiratory parameters in mouse BMDMs treated with vehicle (DMSO), DMSO + oxLDL, 0.1 µM saracatinib or 0.1 µM saracatinib + oxLDL (n = 5, biologically independent samples per condition): basal OCR, ATP production, maximal respiratory OCR, spare respiratory capacity. P values were determined by one-way ANOVA with Dunnet’s post hoc test vs vehicle. Data are presented as mean ± s.d.

