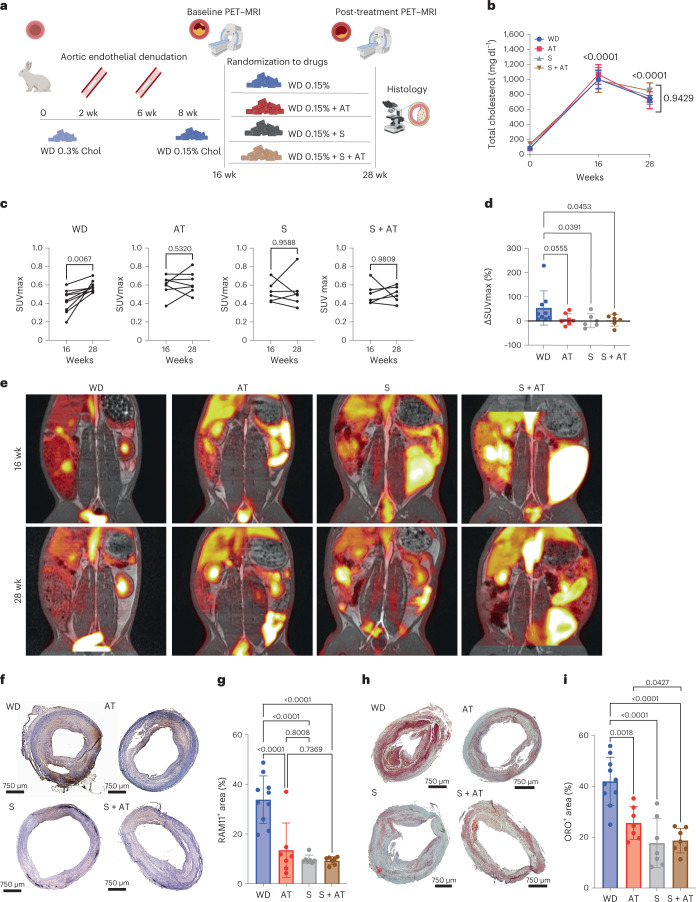
Fig. 8. Effect of saracatinib in a rabbit model of advanced atherosclerosis.
a, Experimental design to study the effect of 4 mg kg−1 d−1 saracatinib (S), 3 mg kg−1 d−1 atorvastatin (AT) or the combination of saracatinib and atorvastatin (S + AT; at 4 and 3 mg kg−1 d−1) on existing plaques in male New Zealand white rabbits. This figure was created with Biorender.com. b, Total cholesterol levels in plasma of rabbits treated with WD, WD plus AT, S and S + AT. Two-way ANOVA with Tukey’s post hoc correction for multiple comparisons. Data are presented as mean ± s.e.m. WD, n = 10; AT, n = 6; S, n = 8; S + AT, n = 8 rabbits. c, Pretreatment (16 weeks) and post-treatment (28 weeks) [18F]FDG uptake by the atherosclerotic arterial wall measured as SUVmax in each treatment group. WD, n = 9; AT, n = 7; S, n = 6; S + AT, n = 6. P values were determined by paired two-tailed t-test. d, Changes in [18F]FDG uptake by the atherosclerotic arterial wall between 16 and 28 weeks, measured as change in SUVmax (ΔSUVmax) in each treatment group. WD, n = 9; AT, n = 7; S, n = 6; S + AT, n = 6. One-way ANOVA with Fisher’s least significant difference test versus WD. Data are presented as mean ± s.e.m. e, Representative images of [18F]FDG PET–MRI of rabbit aortas for each group at 16 and 28 weeks. f, Representative images of RAM11 immunostaining of the rabbit abdominal aortas (4× magnification). g, Bar graphs with overlapping dots of RAM11+ area quantification. WD, n = 10; AT, n = 7; S, n = 7; S + AT, n = 7 rabbits. P values were determined by one-way ANOVA with Tukey’s post hoc test across all groups. Data are presented as mean ± s.d. h, Representative images of ORO staining of the rabbit abdominal aortas (4× magnification). i, Bar graphs with overlapping dots of ORO+ area quantification. WD, n = 10; AT, n = 7; S, n = 7; S + AT, n = 7 rabbits. P values were determined by one-way ANOVA with Tukey’s post hoc test across all groups. Data are presented as mean ± s.d. Chol, cholesterol.

