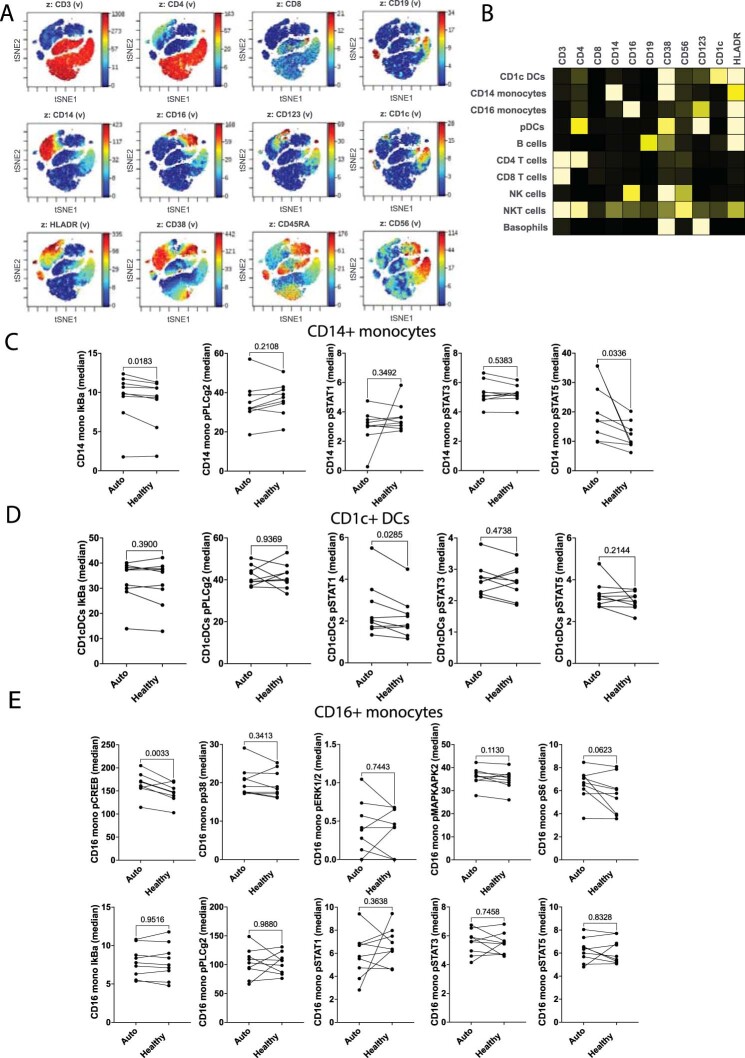
Extended Data Fig. 1. Ex-vivo plasma-stimulated PBMCs from atherosclerotic patients were stained with a panel of antibodies and analyzed by phospho-CyTOF.
A. Expression of surface canonical markers using viSNE in Cytobank. The distribution of each of the clustering parameters is presented as a color scale in z-dimension for manual identification of each cluster immune population in Fig. 1. B. Expression of surface canonical markers visualized using a heat map. C. Dot plots show the effect of autologous plasma vs. healthy plasma on the phosphorylation of intracellular kinases in CD14+ monocytes (n = 9 biologically independent samples; males=5). P values were determined by paired two-tailed t-test. D. Dot plots show the effect of autologous plasma vs. healthy plasma on the phosphorylation of intracellular kinases in CD1c+ DCs (n = 9 biologically independent samples; males=5). P values were determined by paired two-tailed t-test. E. Dot plots show the effect of autologous plasma vs. healthy plasma on the phosphorylation of intracellular kinases in CD16+ monocytes (n = 9 biologically independent samples; males=5). P values were determined by paired two-tailed t-test.

