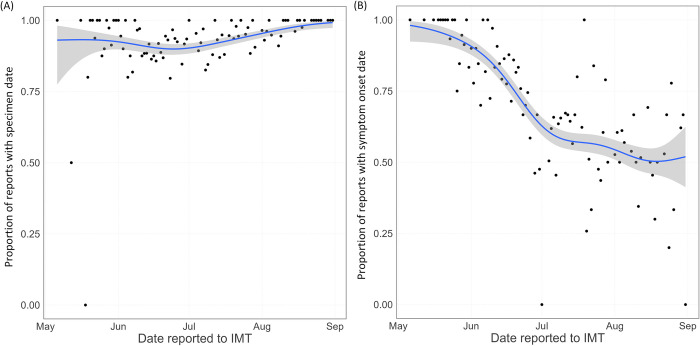
Fig 1. Coverage of the key variables used in the nowcasting during the study period.
Black points show the data, the blue line is a binomial GAM smooth through the data. (A) shows the proportion of reported cases with specimen date recorded, plotted by reporting date. (B) shows the proportion of reported cases with symptom onset date recorded, plotted by reporting date.

