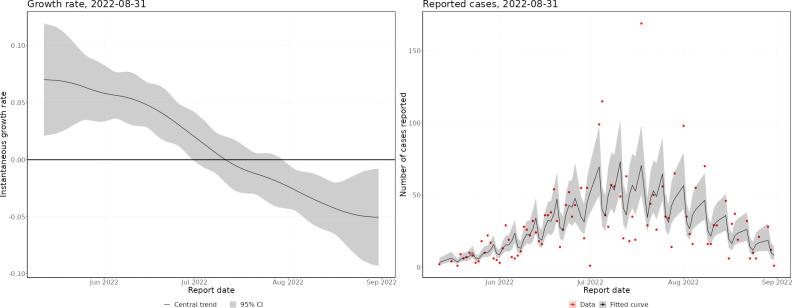
Fig 4. Growth rate by date of report.
Left panel–instantaneous growth rate, the shaded region indicates 95% confidence intervals, with the solid line indicating the median estimate. Right panel–nowcast modelled incidence, the shaded region indicates 95% prediction intervals of the model, with the solid line indicating the median nowcast.

