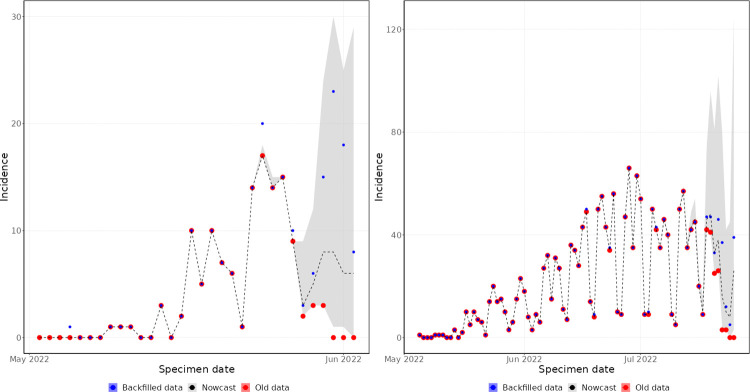
Fig 6. Specimen date historic nowcasting.
Left panel–nowcast generated on 2 June 2022. Right panel–nowcast generated on 25 July 2022. Old data (red) are those available at the time the nowcast was produced. Backfilled data (blue) is the true value of the data. The shaded region (grey) is the 95% prediction interval of the nowcasting model, with median value marked by the dashed line.

