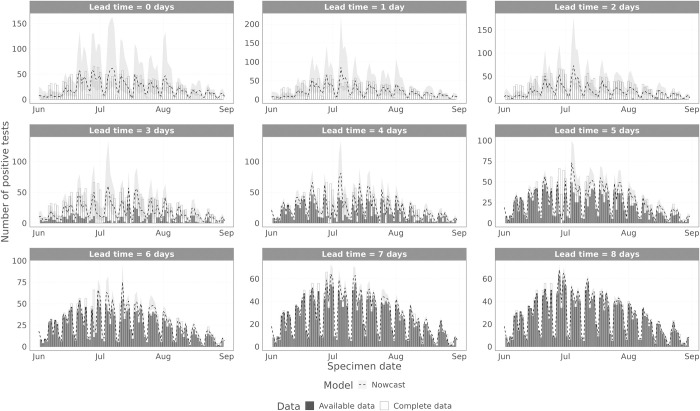
Fig 9. Performance of the non-parametric and parametric nowcasting models by specimen date.
The grey bars indicate the data available at the time of the nowcast, the white bars are the complete data, and the lines are the nowcasting projection, with 95% prediction intervals in the ribbon. Each panel shows a different lead time, where the nowcasting model is trying to predict that many days prior to the current date.

