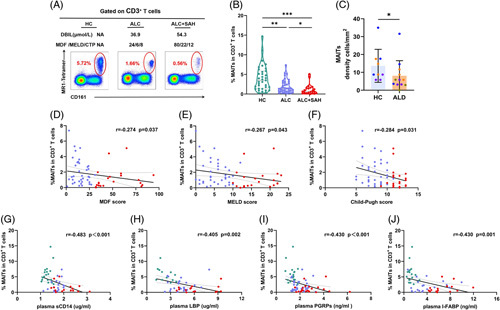
FIGURE 1.

The MAITs’ frequencies decreased with severity of ALD. (A) Representative FACS plots of circulating MAITs’ frequencies (defined as 5-OP-RU/MR1 tetramer+ CD161hi) gated on CD3+ T cells from 1 HC, 1 patient with ALC, and 1 patient with ALC + SAH. (B) Violin plots showing MAITs’ frequencies of peripheral blood from HCs, patients with ALC, and patients with ALC + SAH detected by flow cytometry. The frequencies of MAITs in the ALC + SAH group were significantly lower than that in the ALC group. (C) Summary of density information of TCR Vα7.2+ IL-18+ cells in the liver tissues of HCs and patients with ALD. The density of TCR Vα7.2+ IL-18+ cells in the liver tissues of patients with ALD was significantly lower than that in the HCs. (D–F) Correlation analysis of MAITs’ frequencies and MDF, MELD, and Child-Pugh scores calculated in patients with ALC and patients with ALC + SAH. MAITs’ frequencies were negatively correlated with MDF, MELD, and Child‐Pugh scores in patients with ALC and patients with ALC + SAH. (G–J) Correlation analysis of MAITs’ frequencies and plasma levels of sCD14, LBP, PGRPs, and I-FABP in HCs, patients with ALC, and patients with ALC + SAH. MAITs’ frequencies were negatively correlated with plasma levels of sCD14, LBP, PGRPs, and I-FABP in HCs, patients with ALC, and patients with ALC + SAH. *p < 0.05, **p < 0.01, and ***p < 0.001, (B, C) Nonparametric Mann-Whitney U tests. (D–J) Spearman rank correlation test. Abbreviations: ALC, alcohol-associated liver cirrhosis; ALC + SAH, ALC complicated with severe alcoholic hepatitis; ALD, alcohol-associated liver disease; CTP, Child‐Pugh scores; HC, healthy control; I-FABP, intestinal fatty acid-binding protein; LBP, lipopolysaccharide-binding protein; MAITs, mucosal-associated invariant T cells; MDF, Maddrey discriminant function; MELD, model for end-stage liver disease; PGRPs, peptidoglycan recognition proteins; TCR, T-cell receptor.
