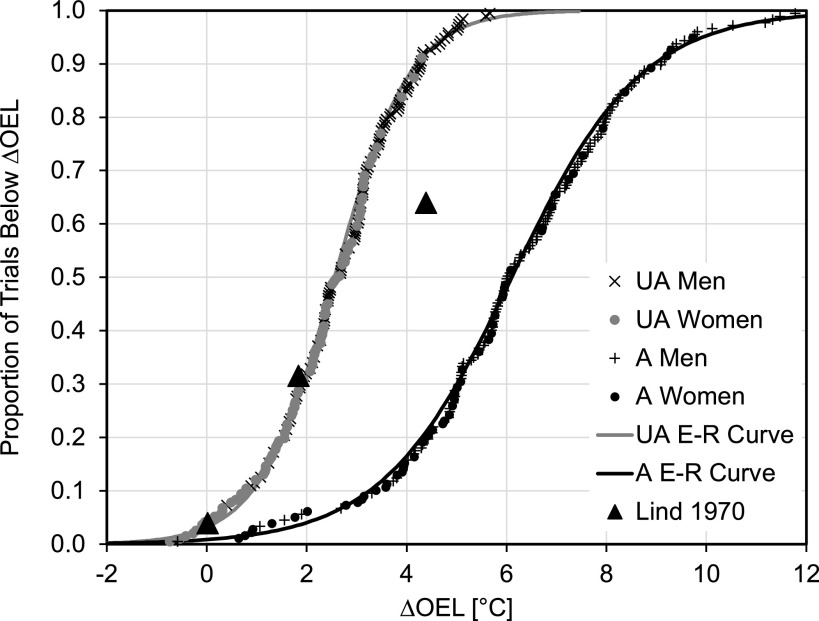
Figure 3.
Upper limit of the prescriptive zone (ULPZ) profiles for unacclimatized (Pennsylvania State University, PSU) (left curve) and acclimatized (University of South Florida, USF) (right curve) participants. The markers represent individual data and the lines represent the ln(odds) regression curve where odds were translated to the cumulative proportion of individual ULPZ values below the ULPZ. The number of participants/observations were for unacclimatized men (UA Men: 24/101), unacclimatized women (UA Women: 26/89), acclimatized men (A Men: 21/121), and acclimatized women (A Women: 9/55). The exposure-response (E-R) curve for all unacclimatized (Eq. 9) and all acclimatized participants (Eq. 10) are included. Lind’s data for unacclimatized men (23) are the solid triangles.

