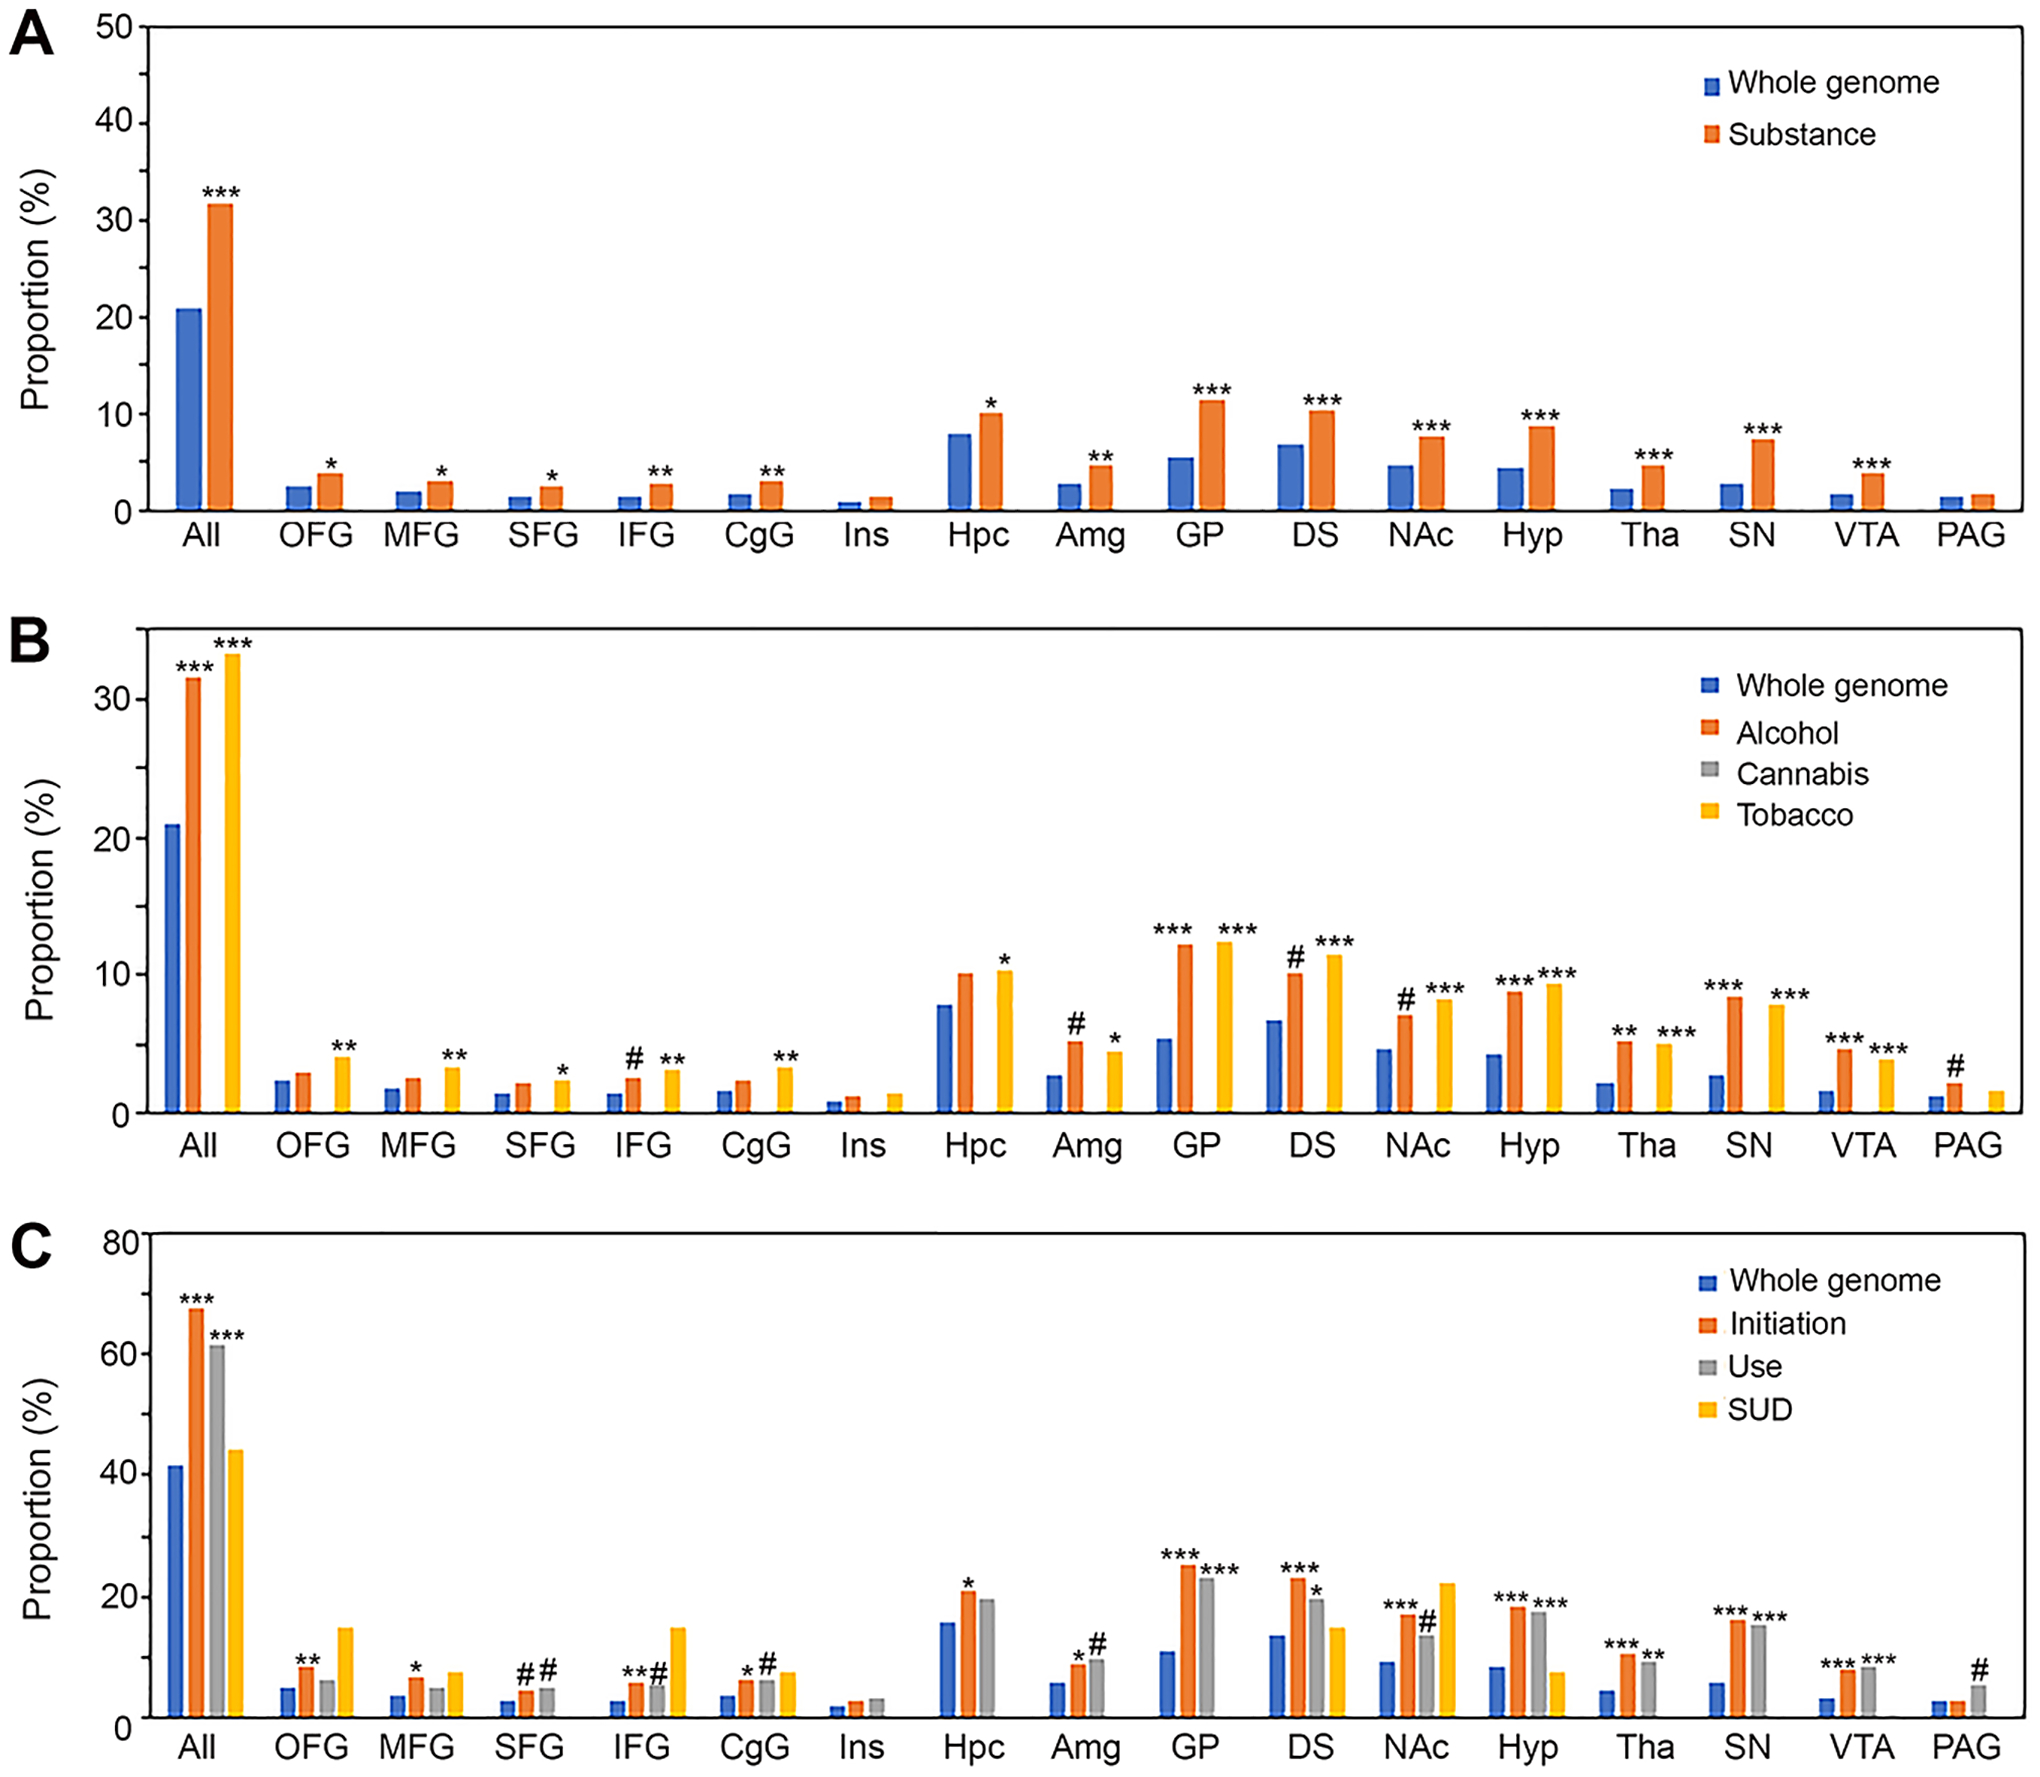
FIGURE 3.

AddictRegion overrepresentation analysis of down-regulated genes. (A) Proportion of all categories of substance-associated genes in each AddictRegion. (B) Proportion of genes in each AddictRegion based on types of substance. (C) Proportion of genes in each AddictRegion based on categories of substance use behavior. All, any of the AddictRegions; *, p<0.05; **, p<0.01; ***, p<0.001 after Bonferroni correction; # indicating p-value <0.05 without Bonferroni correction.
