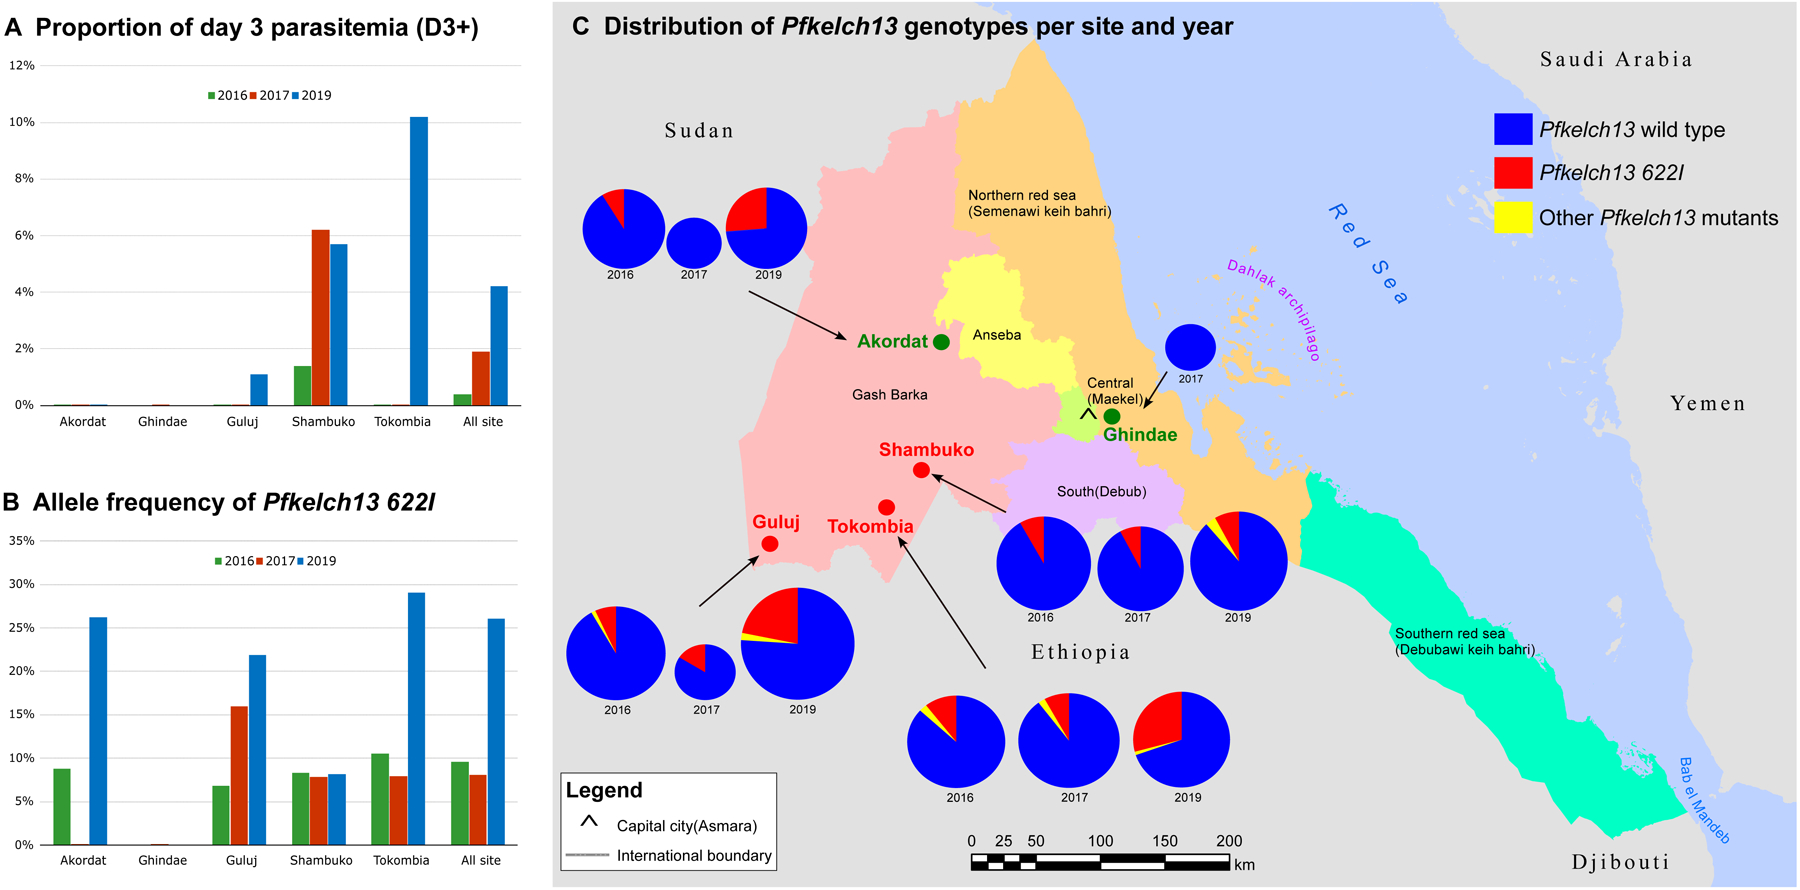
Fig. 1. Evidence of delayed parasite clearance associated with the expansion of the mutant Pfkelch13 622I in Eritrea.

(A) Proportions of D3+ rate per site and year. D3+ cases were not observed in Akordat (2016, 2017 and 2019), Ghindae (2017, no data were available in 2016 and 2019), Guluj (2016 and 2017), and Tokombia ((2016 and 2017). (B) Allele frequency of P. falciparum kelch13 622I mutant parasites per site and year. Only Pfkelch13 wild-type parasites were observed in Akordat and Ghindae in 2017 (no data were available in 2016 and 2019). (C) Distribution of Pfkelch13 genotypes per site and year. The proportions of each Pfkelch13 allele are shown per year in pie charts (except for Ghindae where only 2017 data were available). The frequency for the Pfkelch13 wild type allele is shown in dark blue, the Pfkelch13 622I allele is in red and the other Pfkelch13 mutants are in yellow. The size of the pie chart is proportional to the sample size. The study sites colored in green correspond to areas where no D3+ case was observed. The study sites where D3+ cases where detected are colored in red (Guluj, Tokombia, and Shambuko). Additional information is presented in Tables S1, S6 and S7.
