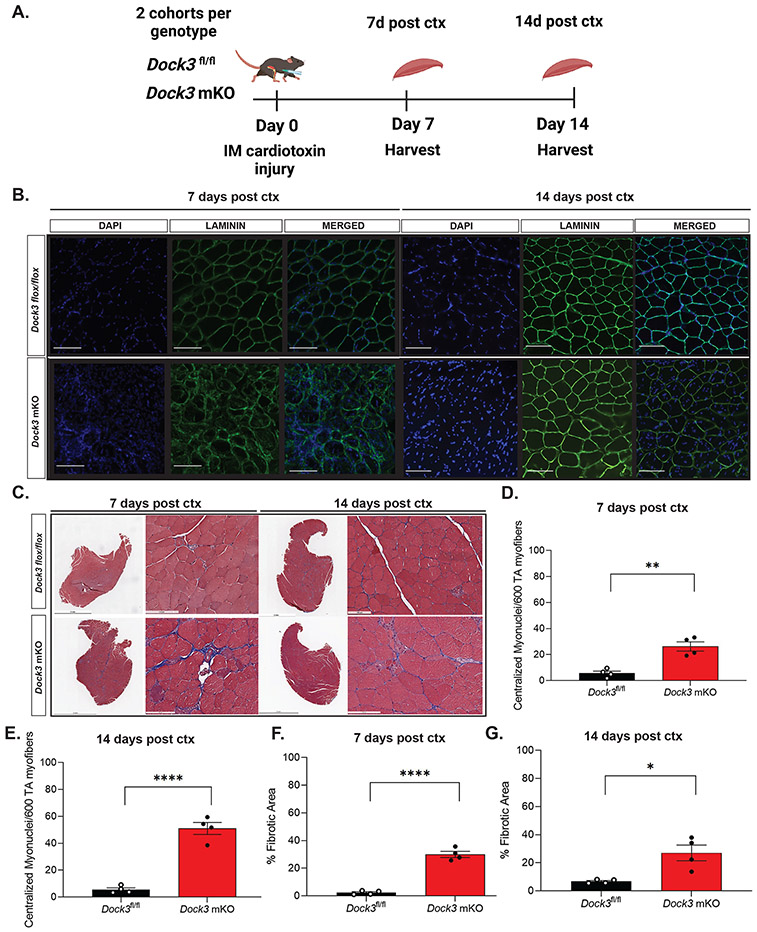
Figure 4. Dock3 mKO mice show impaired skeletal muscle regeneration following injury.
A. Schematic of cardiotoxin (ctx) induced skeletal muscle TA injury. Two separate cohorts of each Dock3 mKO mice and Dock3fl/fl mice were administered with an intramuscular injection of 10 μM of cardiotoxin at Day 0 and separate cohorts were harvested on days 7 and 14 post-injury. B. Cross-section of injured tibialis anterior stained with immunofluorescent antibody against LAMININ (green), DAPI (blue), and the merged image at days 7 and 14 post ctx injury. Scale bar = 100 μm. C. Masson’s trichrome histochemical analysis of injured TA in Dock3fl/fl vs. Dock3 mKO 7 and 14 days post-injury. D. and E. Quantification of histological images from (C) analyzing % centralized myonuclei per 600 fibers at 7 and 14 days post ctx injury. F. and G. Quantification of histochemical images from (C) with analysis of percent (%) fibrotic area in injured TA of Dock3fl/fl vs. Dock3 mKO 7 and 14 days post-injury. Scale bar = 100 μm (20x images) and 2 mm (1x whole TA images). *p < 0.01, **p < 0.001, ****p< 0.0001, n = 4 mice/cohort.

