
Figure 3. Distributions of peak systolic strains at base, mid-ventricle, and apex.
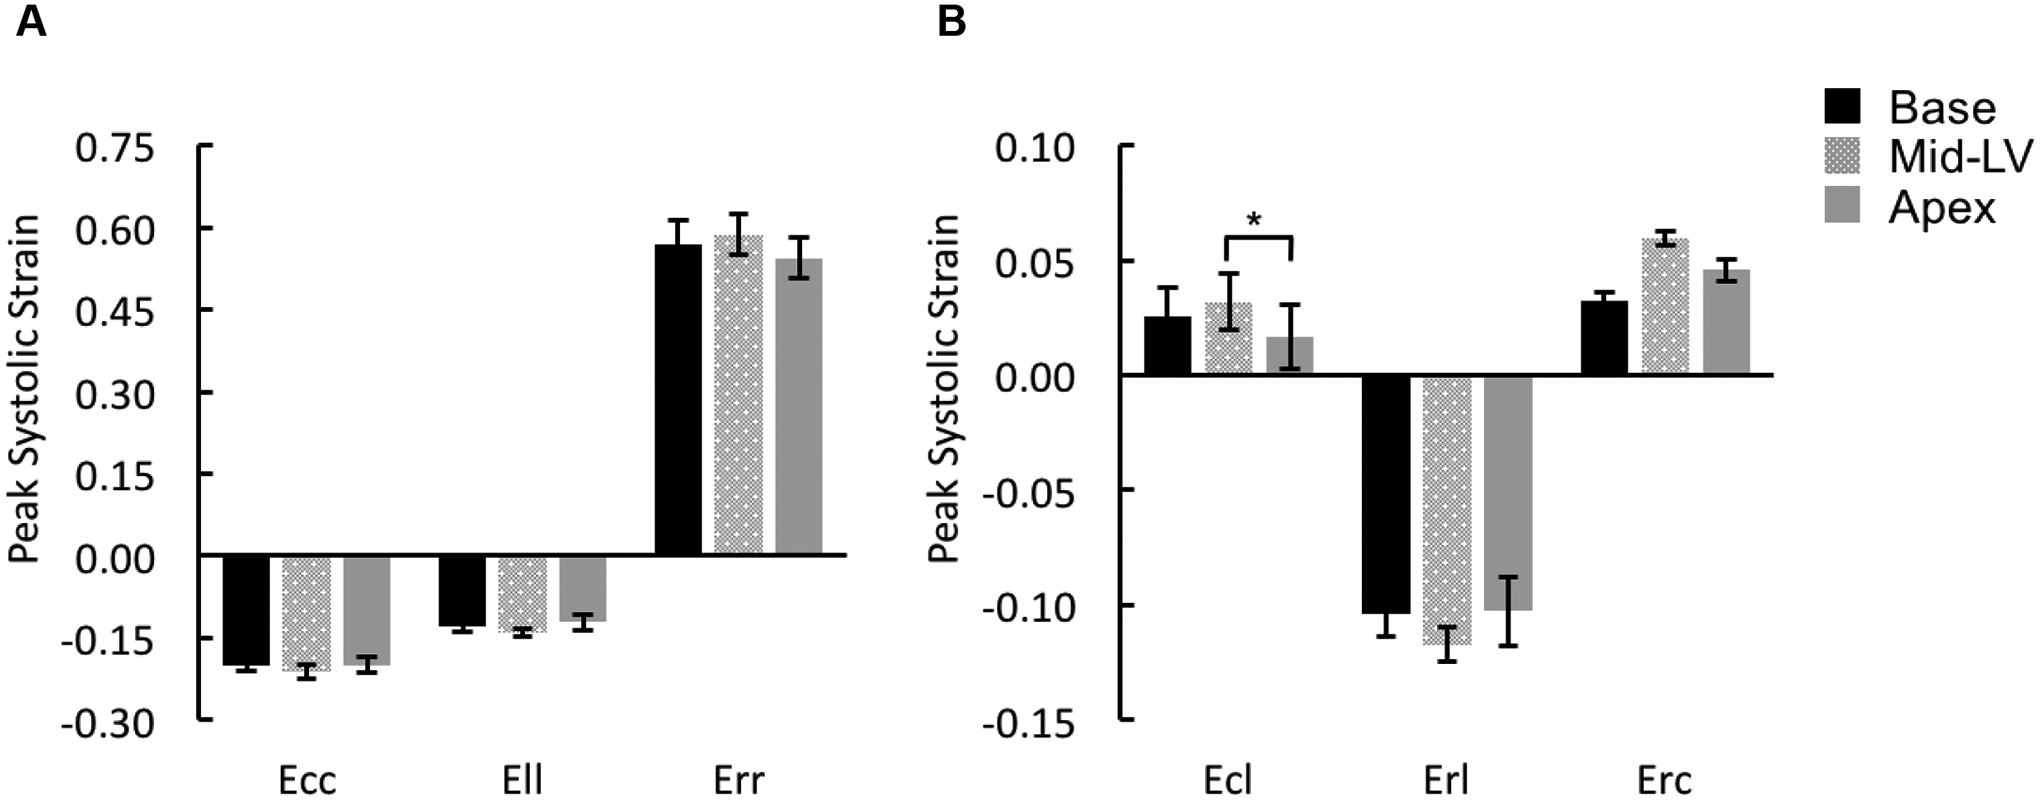
Peak systolic strains for normal components (A: Ecc, Ell, and Err) and shear components (B: Ecl, Erl, and Erc) were averaged over the entire slice at either basal [Base], mid-ventricular [Mid-LV], or apical [Apex] level of rat LVs. *p < 0.05.