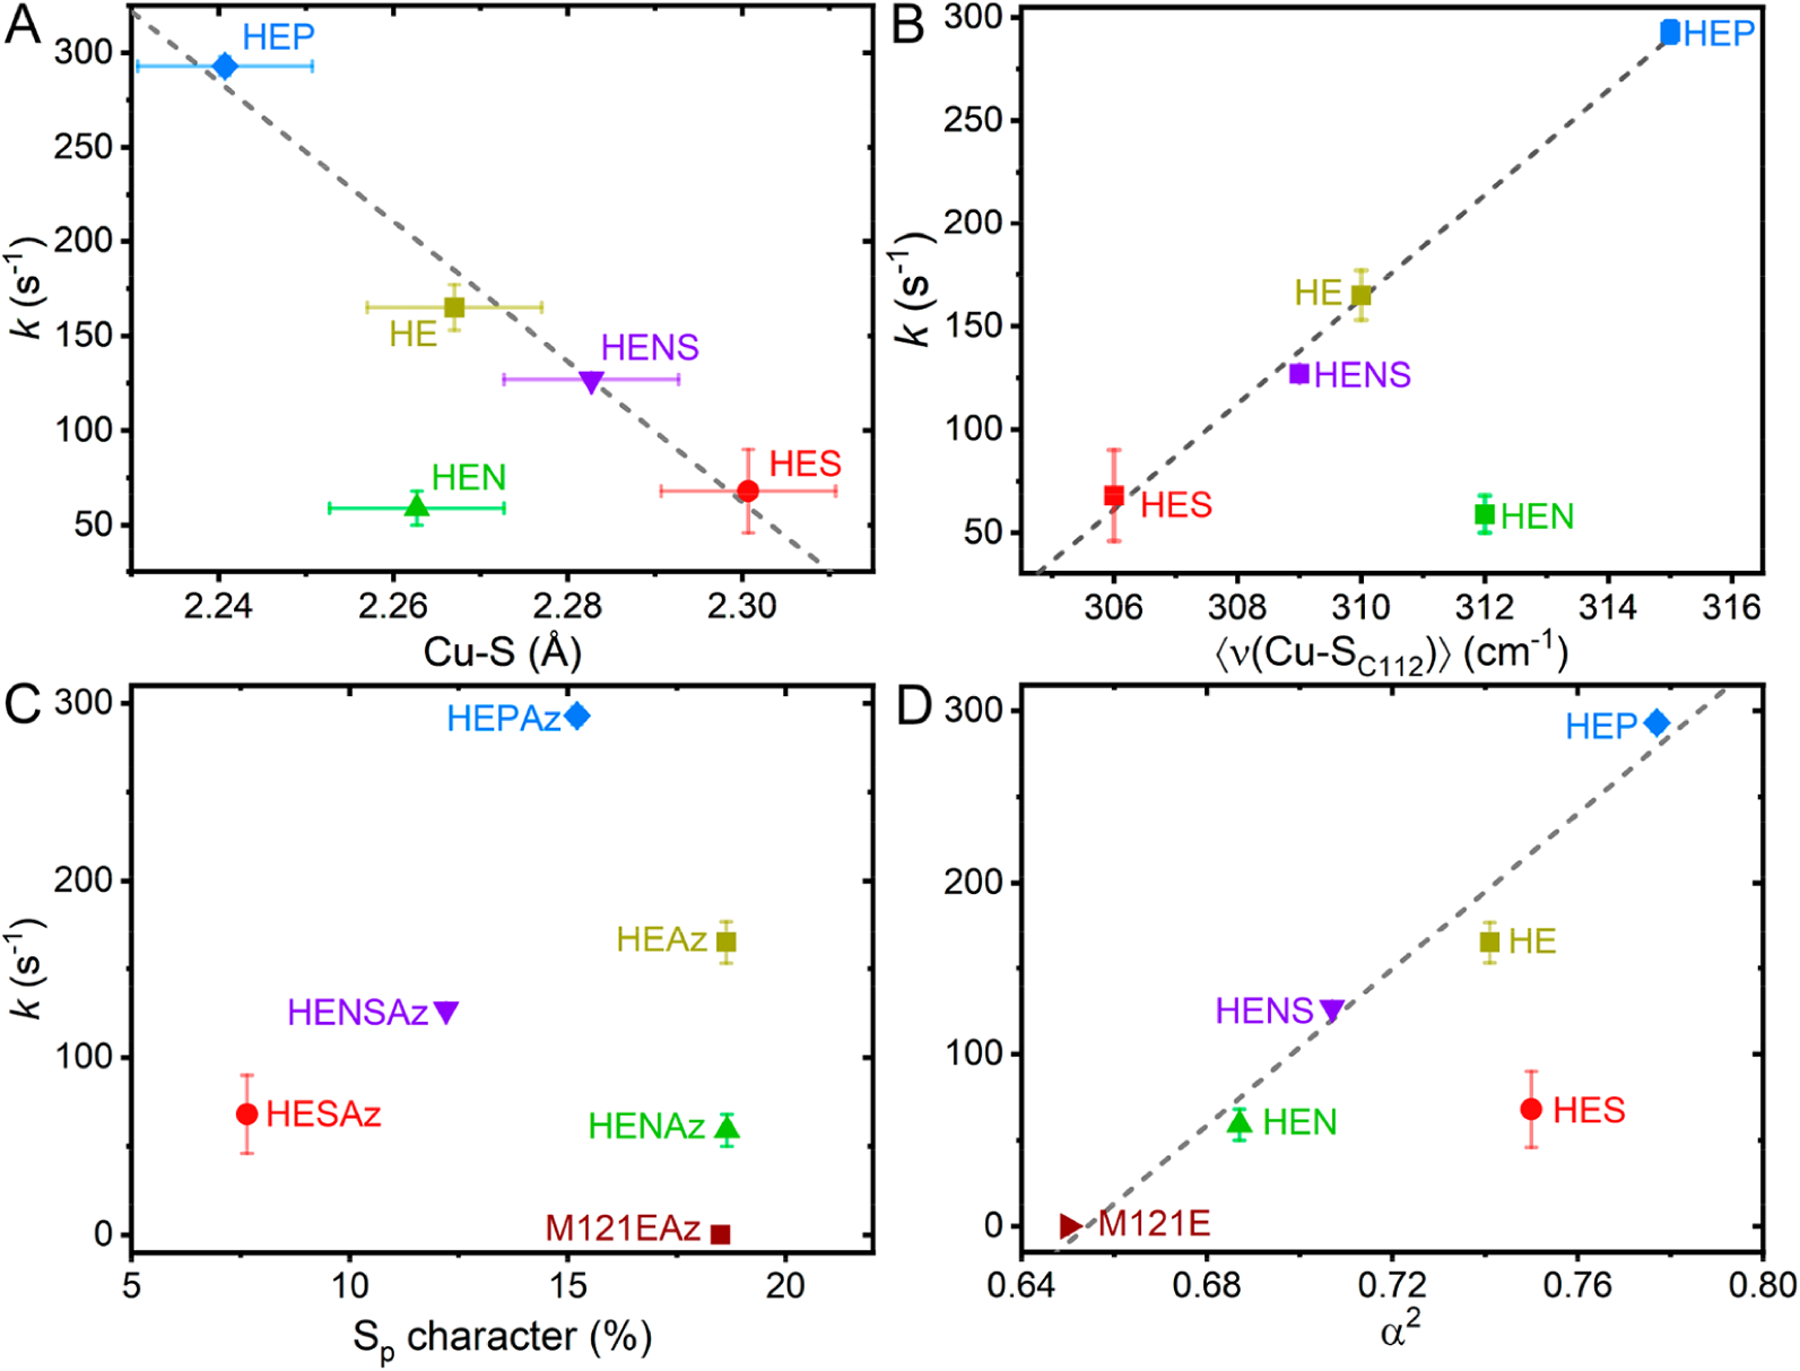
Figure 9.

Comparisons of the pseudo first-order rate constant for S-nitrosylation (k) with spectroscopically derived parameters, including (A) the EXAFS-determined Cu–S scattering distance, (B) the resonance Raman determined intensity weighted average Cu–S stretching frequency 〈ν(Cu–SC112)〉, (C) the S K-edge determined Sp character, and (D) the CW X-band EPR derived metal character. Displayed error bars correspond to σ2. Dashed lines indicate linear least-squares regressions (R2 = 0.979 in A, 0.994 in B, and 0.979 in D), with outliers excluded as follows: HENAz in A and B, HESAz in D.
