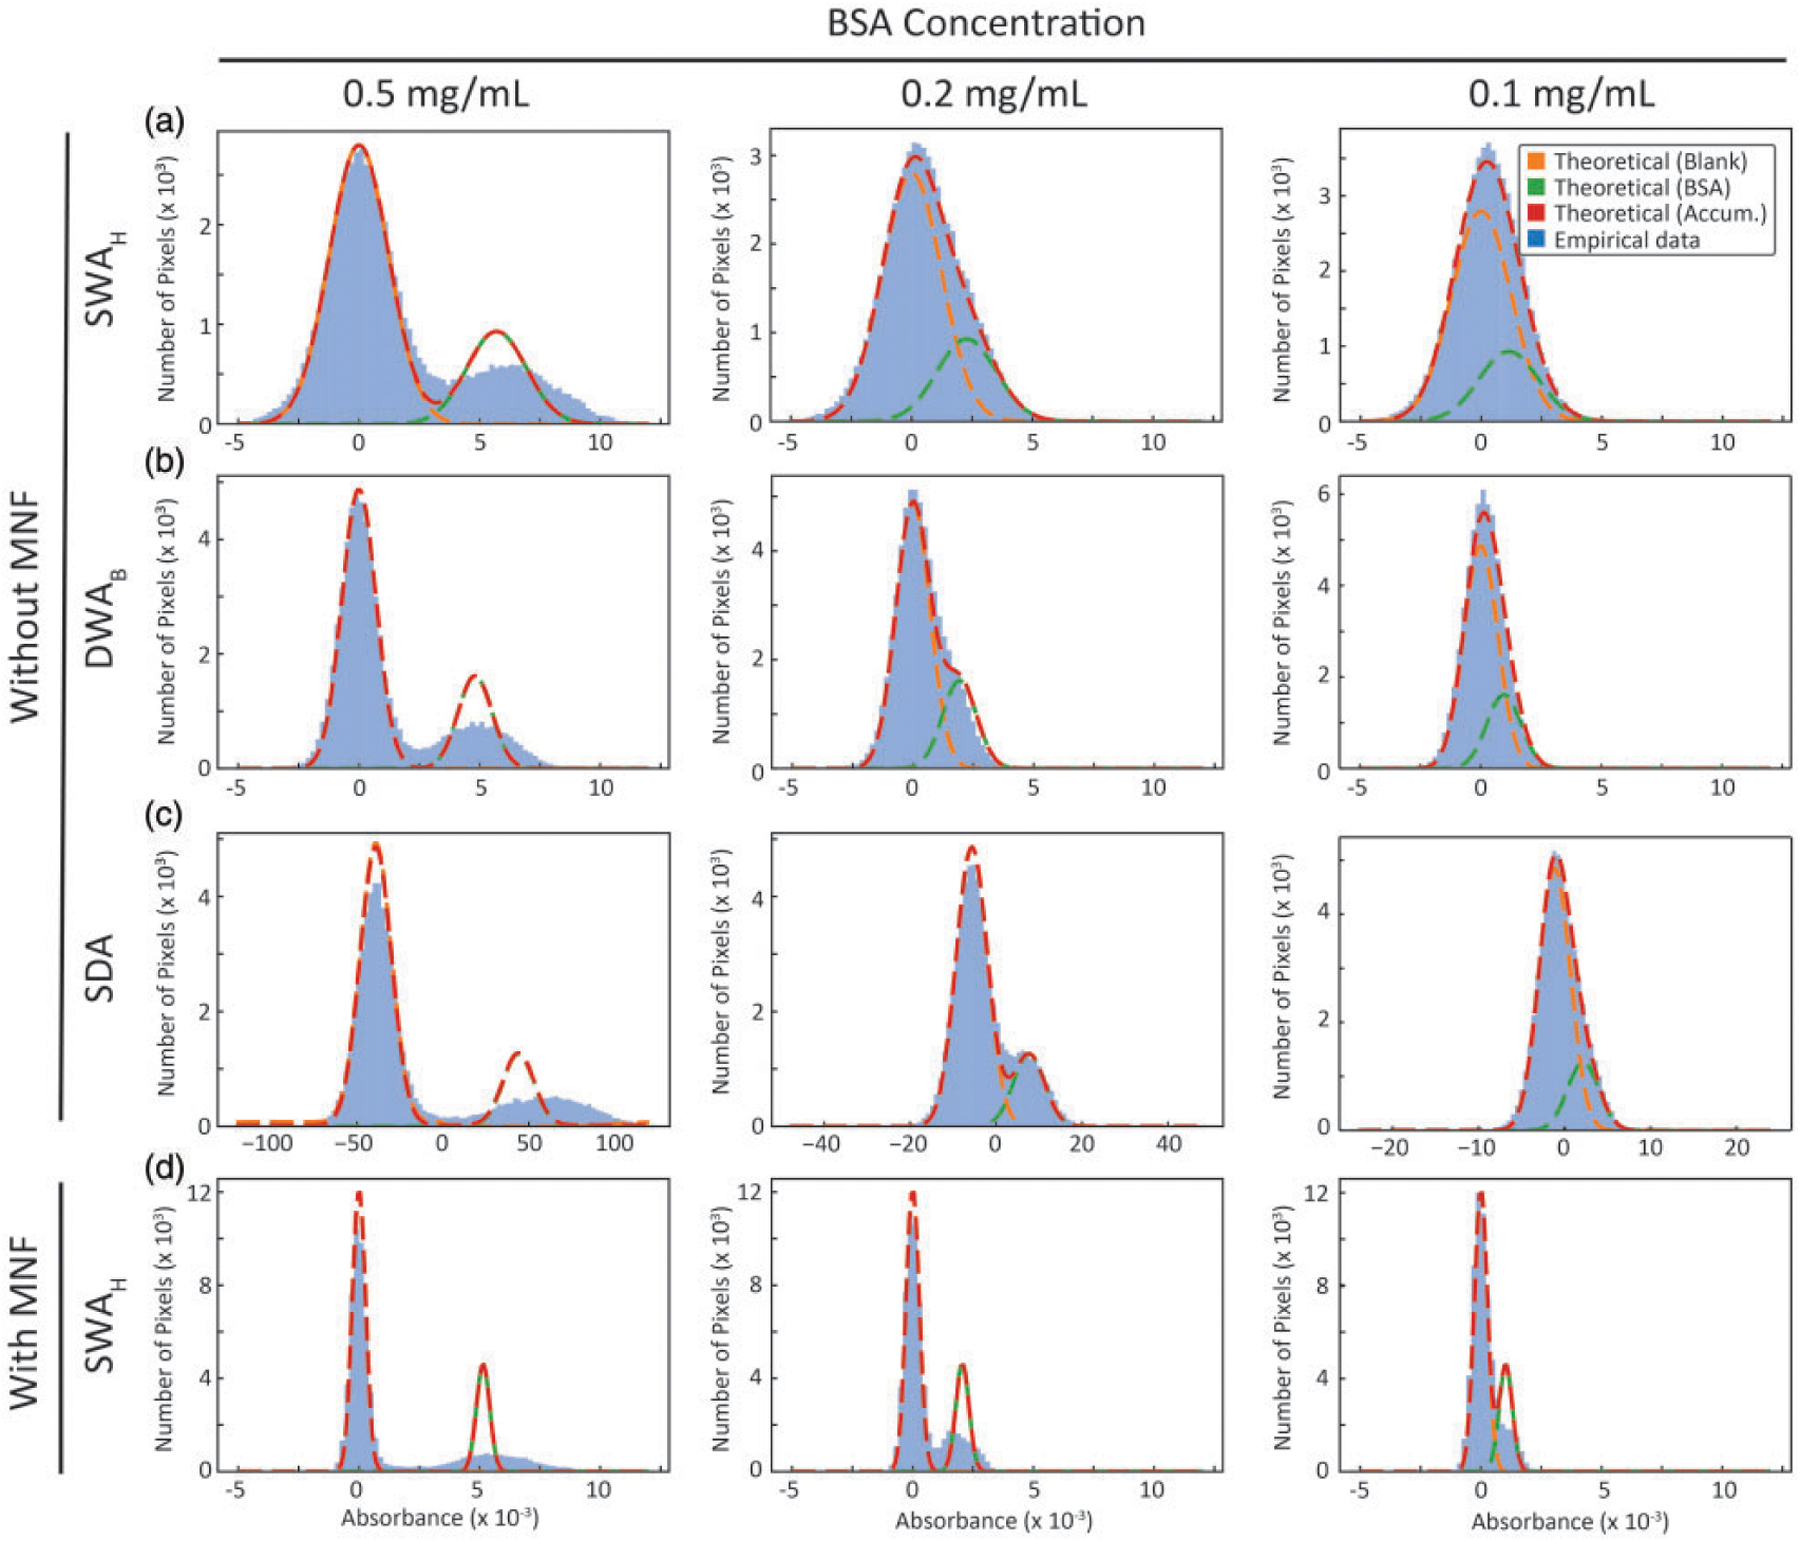
Figure 5.

Histogram of the intensity value distributions for three different cases of BSA concentrations shown in different columns. Rows correspond to various methods, namely, (a) SWAH, (b) DWAB with the best subset, (c) SDA, all without any MNF correction, and (d) SWAH case with MNF correction. Gaussian fits for theoretical blank and sample distributions, and cumulative predicted distribution is projected on the empirical data. Increased standard deviation in the sample distributions is caused by within spot concentration irregularities.
