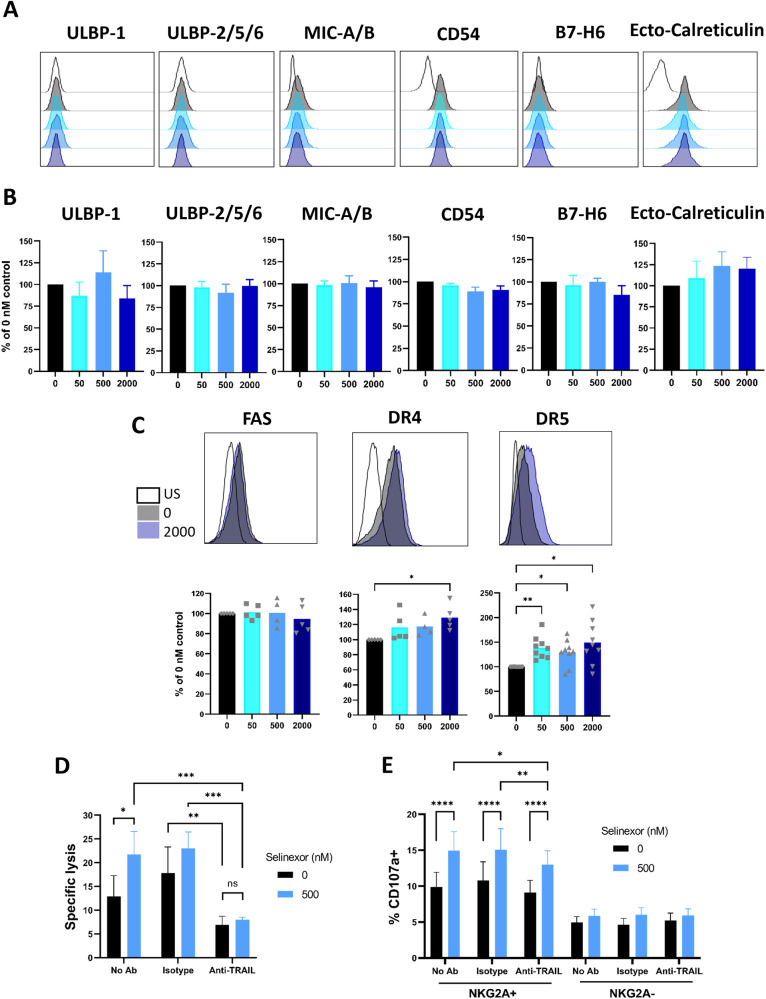
Fig. 4. XPO1 inhibition modulates CLL cell expression of activating NK cell ligands.
Expression of NK cell activating ligands ULBP-1, ULBP-2/5/6, MIC-A/B, B7H6, CD54/ICAM-1 and ecto-calreticulin on CD5 + CD19 + CLL cells after treatment with selinexor (50–2000 nM) for 24 h. Shown are histograms of a representative CLL sample (A) for each ligand and (B) mean ± SEM of multiple CLL donors (N = 3–7 per group). US = unstained. C Expression of death receptors Fas, DR4 and DR5 on CLL cells post selinexor 24-h treatment. Shown are the histograms of a representative CLL donor and below is the mean ± SEM across multiple CLL donors (Fas and DR4 N = 5 and DR5 N = 9). Differences in expression between selinexor concentrations were assessed by repeated measure one-way ANOVA followed by Dunnett’s multiple comparisons test (*P < 0.05, **P < 0.01). NK specific lysis of selinexor-treated (500 nM) CLL targets (D) and NKG2A+ and NKG2A- NK cell activation (E) in the presence of a TRAIL blockade antibody. Isolated NK cells (D) or healthy donor PBMC (E) were incubated with 10 µg/mL anti-TRAIL or isotype control antibody for 20 min prior to co-culture with selinexor-treated CLL cells. Shown is mean ± SEM (D: N = 6 and E: N = 8) and differences in NK specific lysis and NK cell activation between treatments were calculated with repeated-measure two-way ANOVA followed by Tukey’s post-hoc test (*P < 0.05, **P < 0.01, ***P < 0.005, ****P < 0.001).

