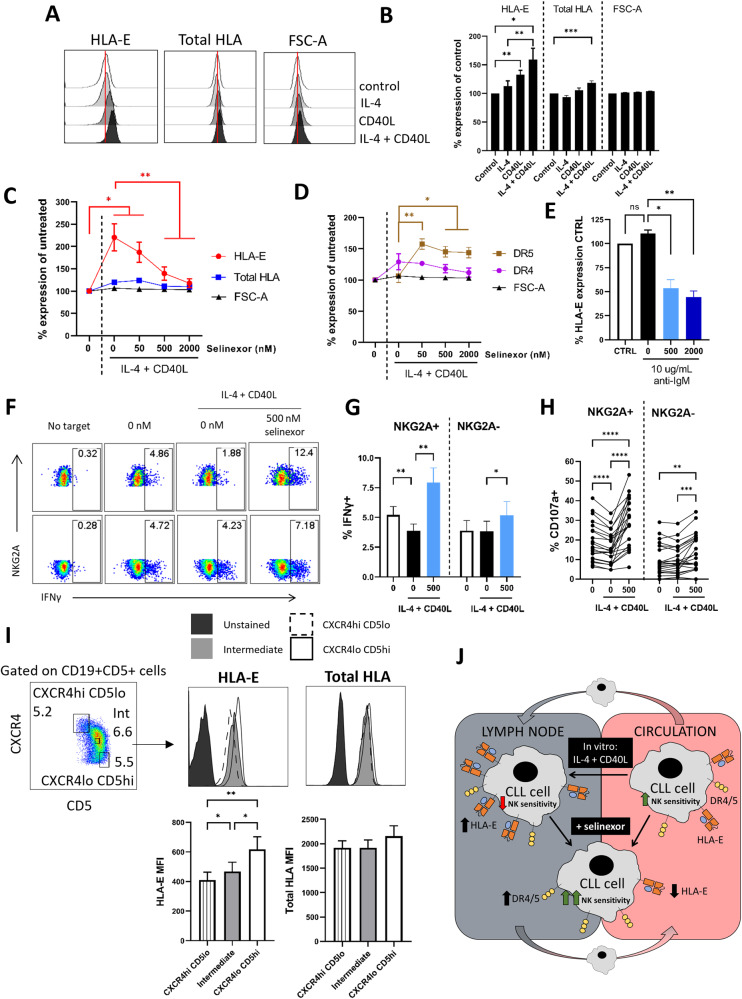
Fig. 7. IL-4 + CD40L stimulation inhibits NK cell activity against CLL cells, which is overcome by XPO1 inhibition.
Expression of HLA-E and HLA class I molecules (Total HLA) on CD19 + CD5 + CLL cells after incubation with IL-4 (10 ng/mL) and CD40L (300 ng/mL) alone or in combination for 24 h. Representative histograms from one CLL sample is shown in (A). Cell size was assessed by FSC-A. Shown in (B) is the mean ± SEM (N = 18) percentage expression of HLA-E or total-HLA relative to the untreated control. Differences in expression between conditions were assessed by repeated-measure two-way ANOVA followed by Tukey’s post-hoc test (*P < 0.05, **P < 0.01, ***P < 0.005). Expression of HLA-E and total HLA class I (C) and DR4 and DR5 (D) on CD19 + CD5 + CLL cells after treatment with selinexor (50–2000 nM) for 24 h in the presence of IL-4 (10 ng/mL) and CD40L (300 ng/mL). Shown is the mean ± SEM of 12 CLL patient samples and differences in expression between conditions were assessed by repeated-measure two-way ANOVA followed by Tukey’s post-hoc test (*P < 0.05, **P < 0.01). E HLA-E expression on CLL cells treated with selinexor following BCR stimulation. CLL cells were incubated with 10 µg/mL plate-immobilised anti-IgM F(ab’)2 fragments for 1 h then selinexor (500–2000 nM) or DMSO (0 nM) was added for a further 24 h before assessment of HLA-E expression. Shown is mean ± SEM relative to the untreated control (N = 3) and differences in expression between treatments were calculated by repeated-measure one-way ANOVA followed by Tukey’s post-hoc test (*P < 0.05, **P < 0.01). NK cell activity measured by expression of IFNγ (F, G) and CD107a (H) in NKG2A+ and NKG2A- NK cells when heathy donor PBMC were co-cultured for 4 h with CLL cells (E:T = 1:1). CLL cells were pre-treated with 500 nM selinexor or DMSO (0 nM) in the presence of IL-4 (10 ng/mL) and CD40L (300 ng/mL) for 24 h. A representative example for IFNγ expression is shown in (F). Graph in (G) shows mean ± SEM (N = 19) and in (H) each individual co-culture is represented by a dot (N = 22 per condition). Significant differences in NK activation between conditions were assessed by repeated-measure two-way ANOVA followed by Tukey’s post-hoc test (**P < 0.01, ***P < 0.005, ****P < 0.001). I HLA-E and total HLA expression on CLL cell populations with differential expression of CXCR4 and CD5. Shown is the gating strategy used to identify CXCR4hi(high) CD5lo(low) and CXCR4lo CD5hi CLL cells and CLL cells with intermediate expression of CXCR4 and CD5. For each population, gates were drawn around ~5–7% of total CD19 + CD5 + CLL cells and HLA-E and total HLA expression was assessed as shown above for one representative CLL donor. Below is the summary (mean ± SEM) of the geometric MFI (MFI) for HLA-E and total HLA across 10 different CLL donors. Differences in expression between CLL cell populations were calculated using repeated-measure one-way ANOVA followed by Tukey’s post-hoc test (*P < 0.05, **P < 0.01). J Schematic diagram for the modulation of CLL cell sensitivity to NK cell cytotoxicity by lymph node associated signals and selinexor. The lymph node associated signals IL-4 and CD40L upregulate surface HLA-E on CLL cells, and this inhibits NK cell effector function via NKG2A. Selinexor reduces HLA-E expression on CLL cells in both the absence and presence of IL-4 + CD40L and thereby increases the sensitivity of CLL cells to NK cell activity. In addition, selinexor increases expression of the TRAIL death receptors DR4 and DR5 on CLL cells and this contributes to the enhanced NK cell activation against CLL cells.

