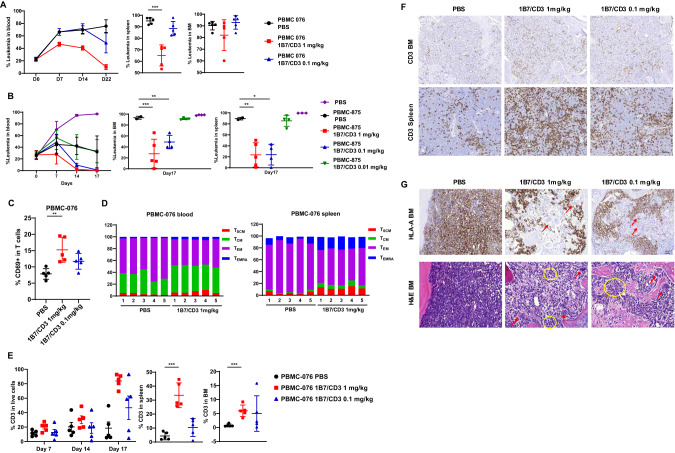
Fig. 4. Anti-tumor activity of 1B7/CD3 treatment in the Bos-1 ALL patient-derived xenograft (PDX) model across donors.
Three million Bos-1(CD19+TSLPR+) ALL PDX cells were I.V. injected into NSG mice, and Bos-1 engraftment were assessed by analyzing the percentage of ALL cells (hCD45+) in peripheral blood with flow cytometry. Humanization and treatment are same as in Fig. 3A. Leukemia burden was assessed as percentage of hCD45+/ TSLPR+ cells in single live cell population after humanization. A TSLPR antibody (1B4, BioLegend), non-competing with 1B7/CD3, was used for staining. A, B Tumor burden, in the blood, spleen, and bone marrow (BM) in (A) donor 076 (PBMC 076) and (B) 875 (PBMC 875) humanized mice treated with 0.1 or 1 mg/kg 1B7/CD3 or control (PBS). Spleen and BM were harvested 3 days post last dosing. Data are shown as mean ± SD; ***p < 0.001, **p < 0.01, *p < 0.05 compared with control. C Percentage of CD69 in CD3 T cells in the blood of donor 076 humanized mice (PBMC 076) treated with 0.1 or 1 mg/kg 1B7/CD3 or control (PBS) at week 2 post dosing. Data are shown as mean ± SD; **p < 0.01 compared with control. D Dynamic shifting of the T cell phenotype in the blood and spleen in donor 076 humanized mice (PBMC-076) treated with 1 mg/kg 1B7/CD3 or control (PBS). TSCM, stem memory T cells; TCM, memory T cells; TEM, effector memory T cells; TEMRA, effector memory cells re-expressing CD45RA T cells. E Percentage of CD3+ T cells in the blood, spleen, and BM in donor 076 humanized mice (PBMC-076) treated with 0.1 or 1 mg/kg 1B7/CD3 or control (PBS). Blood samples were collected at indicated times; spleen and BM samples were collected at 3 days post last dosing. Data are shown as mean ± SD; ***p < 0.001 compared with control. F Immunohistochemistry (IHC) analysis of CD3 T cells in the spleen and BM in donor 076 humanized mice treated with 0.1 or 1 mg/kg 1B7/CD3 or control (PBS) at 3 days post last dose. G HLA-A IHC analysis (upper panel) and hematoxylin & eosin staining in BM (lower panel) in donor 076 humanized mice at 3 days post last dose. Yellow circles indicate mouse polymorphonuclear cells; red arrows indicate mouse megakaryocytes.

