ABSTRACT
Background
A presumed cause of metabolic acidosis in chronic kidney disease (CKD) is accumulation of unmeasured anions, leading to a high anion gap (AG). In patients with CKD with a high AG, only minor increases are expected. The aim of this study is to evaluate the magnitude of the AG in documented steady state CKD to examine the effect of CKD on a high-AG metabolic acidosis (HAGMA).
Methods
In this cross-sectional study the AG, bicarbonate, and chloride were evaluated in 1045 blood and urine samples of 501 patients with steady state CKD in the outpatient clinic. The influence of phosphate, albumin and potassium on the AG were evaluated.
Results
The mean AG increased from 8.8 mEq/l (±1.57) in CKD stage 1 to 11.2 mEq/l (±2.22) in CKD stage 5 (P < 0.001). Correction for albumin or phosphate did not influence the magnitude of the AG. Correction for potassium did alter the prevalence of HAGMA, but not the severity. [HCO3−] decreased between CKD stages 1 and 5 by 5.1 mEq/l. The [Cl−] increased by 2.6 mEq/l between CKD stages 1 and 5.
Conclusions
The elevation of the AG in patients with steady state CKD is limited and less pronounced than the decrease in [HCO3−]. Normal AG metabolic acidosis seems to be more important in CKD than HAGMA. The CKD stage and the magnitude of the AG should be taken into account when evaluating a patient with HAGMA. This study suggests that an AG >15 mEq/l is rarely due to renal failure alone.
Keywords: anion gap, bicarbonate, chloride, CKD, electrolytes
INTRODUCTION
Metabolic acidosis is a complex and common finding in patients with chronic kidney disease (CKD) [1]. A diagnostic concept in the evaluation of metabolic acidosis is the anion gap (AG), which is based on the balance of the main serum electrolytes and electroneutrality [2, 3]. The difference in concentration between the most prevalent cation [sodium (Na+)) and the most prevalent anions (chloride (Cl−) and bicarbonate (HCO3−)] is the AG, which mainly consists of the weak acid albumin (Emmett). With loss of [HCO3−], alterations in [Cl−] establish electroneutrality, resulting in a normal AG at the expense of elevated [Cl−], also called hyperchloraemic metabolic acidosis (NAGMA). In acidosis with accumulation of negatively charged weak acids, electroneutrality already exists and the [Cl−] does not alter. Therefore, the AG increases resulting in a high-AG metabolic acidosis (HAGMA).
Metabolic acidosis in renal failure is multifactorial. Basic metabolism and nutrition results in endogenous non-volatile acid production, which is generally estimated to be 1 mEq/kg body weight per day, depending on the diet, and naturally excreted by the kidney [4, 5]. However, in CKD the acid excretion is limited, leading to metabolic acidosis. This occurs mainly through three mechanisms. First, the tubular regeneration of HCO3− is impaired and more Cl− is reabsorbed [6] leading to NAGMA. Moreover, acid excretion declines through impaired tubular excretion of ammonium after initially a compensatory enhanced excretion per nephron [7, 8], also leading to NAGMA. Finally, impaired excretion of organic anions, e.g. phosphate, sulphate, urate, and hippurate can lead to accumulation of these unmeasured anions, leading to HAGMA [9].
In our experience, HAGMA in patients with CKD is frequently attributed to the pre-existing renal insufficiency, leaving the severity of CKD and the magnitude of the AG unconsidered. However, because the concentrations of retained organic anions are generally low [10–12], only a limited increase of the AG can be expected. A previous study found a minor increase in AG with an eGFR <45 ml/min 1.73 m2 in a nationwide database, of which most had normal or only slightly impaired renal function [13].
Knowledge of to what extend the AG is influenced by CKD can prevent underestimation of other acid–base disorders.
In this study, the magnitude of the AG, and concentration of chloride and bicarbonate in patients with documented steady state CKD in the outpatient renal clinic are evaluated.
Additionally, the influence of albumin, phosphate and potassium on the AG is evaluated in different CKD stages. Furthermore, the contribution of NAGMA and the potential effect of estimated protein intake on the AG were assessed. Finally, evaluation of the AG was compared to the strong ion gap according to the Stewart approach.
MATERIALS AND METHODS
Patients from the outpatient renal clinic with a documented steady state renal function, defined as serum creatinine levels with <10% change over 3 months, were included. Patients undergoing renal replacement therapy or acute health related complications were excluded.
Patients underwent routine laboratory tests including venous blood gas analysis during every visit and 24-hour urine samples were regularly collected.
The routine measurements including inorganic phosphate, albumin and 24-hour urine samples were done by Roche Cobas 8000®. The electrolyte measurements were done by point-of-care venous blood gas analysis (ABL90 FLEX Analyzer®).
Initially, the most straightforward formula for AG was used (Table 1), as this is the most often used and the most practical approach in clinical settings. In addition, to evaluate the contribution of changes in the components of the measured AG, the AG was corrected for multiple factors.
Table 1:
The formulas used to calculate the AG, SIG, strong ion difference in mEq/l, and protein intake in g/kg/day.
| Abbreviation | Formula | Normal value (mEq/l) | |
|---|---|---|---|
| Anion gap | AG | [Na+] − ([Cl−]+[HCO3−]) | 8–12 |
| AG corrected for albumin | AGalb | AG + 0.25 × (40–[Albumin]) | 8–12 |
| AG corrected for phosphate | AGph | AG − [HPO42− + H2PO4−] | 7–11 |
| AG corrected for potassium | AGk | AG + [K+] | 12–16 |
| Apparent strong ion difference | aSID | [Na+ + K+ + (2*iCa) + Mg2+] − [Cl− + lactate−] | 38–42 |
| Effective strong ion difference | eSID | 2.46 × 10⁻⁸ × pCO2/(10−pH)+[Alb]× (0.12 × pH − 0.631) + [phosphate] × (0.309 × pH − 0.469) | 38–42 |
| Strong ion gap | SIG | eSID − aSID | ∼0 |
| Protein intake | 0.18 × 24 h urea excretion + 15 + 24 h total protein excretion | 0.8–1.2 g/kg/day |
Hypoalbuminaemia can lower the AG by 0.25 mEq/l per 1 g/l decrease in serum albumin (Emmett). The AG was therefore adjusted for serum albumin (AGalb), with the same normal values as the initial AG measurement (Table 1).
The AG is also corrected for inorganic phosphate (HPO42− and H2PO4−) as a contributor of the AG in renal failure (AGph). Because of a normal inorganic phosphate concentration of 0.70–1.50 mEq/l, a normal value of 7–11 mEq/l was presumed. Finally, the AG was corrected for [K+], because elevated [K+] in renal failure might be of significant effect (AGk).
The relative influence of NAGMA and HAGMA is evaluated by the measuring the difference between ∆HCO3− and ∆AG (∆HCO3−-∆AG), calculated with a normal [HCO3−] of 24 mEq/l and a normal AG of 8 mEq/l. A positive value is consistent with a decline in [HCO3−], that is not explained by the AG and can only be explained by a degree of NAGMA.
Furthermore, the effect of protein intake was evaluated. Protein intake was estimated using the renal urea excretion and proteinuria. Protein intake of <0.8 g/kg/day was considered low, 0.8–1.2 g/kg/day normal, and >1.2 g/kg/day high.
Finally, the Stewart approach was used to evaluate the metabolic acidosis in different CKD stages, with calculation of the apparent and effective strong ion difference (aSID and eSID) and the strong ion gap (SIG).
Statistics
Comparison of the means of corrected and uncorrected AG, aSID, eSID, and SIG in the different CKD stage groups was done using one-way ANOVA and the Tukey post hoc test.
Correlation measurement was done using Pearson’s correlation coefficient.
RESULTS
Population
A total of 1045 blood samples and 759 24-hour urine samples were collected in 501 patients with documented steady state renal failure. The main characteristics are described in Table 2.
Table 2:
Baseline characteristics.
| Total | Unique cases | |
|---|---|---|
| (N=1045) | (N=501) | |
| Male (%) | 571 (54.6) | 267 (53.3) |
| Age (SD) | 60.3 (15.9) | 61.6 (15.7) |
| BMI (SD) | 26.8 (5.6) | 27.0 (5.1) |
| BMI (kg/m2) | (n=998) | |
| <20 | 8 (0.8) | 4 (0.8) |
| 20-25 | 348 (33.3) | 168 (33.5) |
| 25-30 | 411 (39.3) | 172 (34.3) |
| 30-40 | 214 (20.5) | 104 (20.8) |
| >40 | 17 (1.6) | 9 (1.8) |
| Etiology (%) | ||
| ANCA-associated vasculitis | - | 119 (23.8) |
| Nephrosclerosis | - | 76 (15.2) |
| Diabetes nephropathy | - | 35 (7.0) |
| ADPKD | - | 21 (4.2) |
| IgA nephropathy | - | 21 (4.2) |
| Urologic disease | - | 17 (3.4) |
| Miscellaneous | - | 289 (57.7) |
| KDIGO stage (%) | ||
| 1 | 119 (11.4) | 42 (8.4) |
| 2 | 262 (25.1) | 93 (18.6) |
| 3a | 187 (17.9) | 66 (13.2) |
| 3b | 157 (15.0) | 72 (14.4) |
| 4 | 225 (21.5) | 155 (30.9) |
| 5 | 95 (9.1) | 73 (14.6) |
| Systolic blood pressure (SD) | 125.3 (16.0) | 127.0 (16.2) |
| Diabetes Mellitus (%) | 228 (21.8) | |
| Type 1 (%) | 7 (0.7) | |
| Type 2 (%) | 221 (21.1) | |
| Insulin dependent (%) | 80 (7.6) | |
| Protein intake (g/kg/day) | (n=833) | |
| < 0.8 | 240 (23.0) | |
| 0.8-1.2 | 444 (42.5) | |
| >1.2 | 149 (14.3) |
Samples were collected in patients with different KDIGO CKD stages with a total of 119 (11.4%) with stage 1, 262 (25.1%) with stage 2, 185 (17.7%) with stage 3a, 157 (15.0%) with stage 3b, 225 (21.5%) with stage 4, and 97 (9.3%) with stage 5.
Anion gap
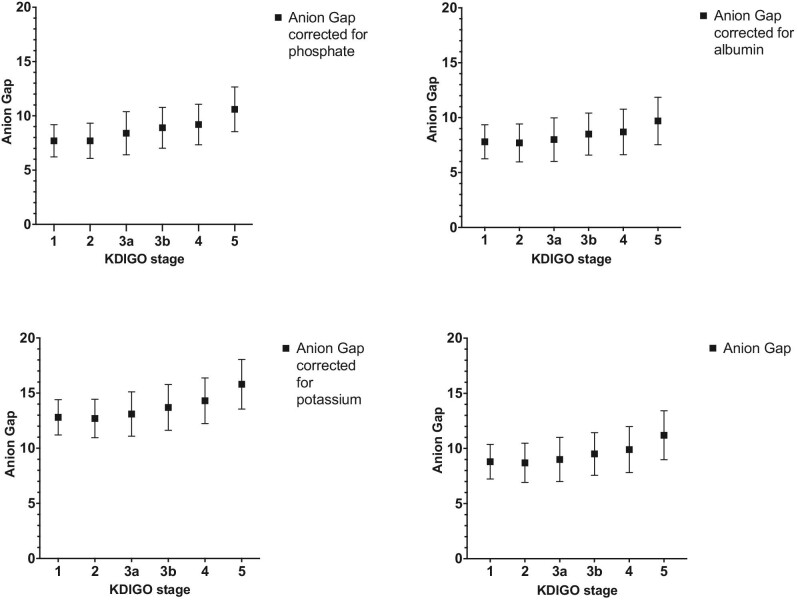
There was an increase in AG of 2.4 mEq/l between CKD stage 1 and 5, with a mean AG of 8.8 mEq/l (±1.57) and 11.2 mEq/l (±2.22) in CKD stages 1 and 5, respectively, P < 0.001 (Table 3, Fig. 1). The AG in CKD stage 1 differs significantly from that in CKD stage 4 and 5 (P < 0.001). The AG in CKD stage 5 is significantly higher than in any other CKD stage (P < 0.001).
Table 3:
AG in different CKD groups (mEq/l); AGalb = Albumin corrected anion gap, AGph = Phosphate corrected anion gap, AGk = potassium corrected anion gap.
| CKD stage | AG (SD) n = 1045 | AGalb (SD) | AGph (SD) | AGk (SD) |
|---|---|---|---|---|
| 1 | 8.8 (1.57) | 7.8 (1.55) | 7.7 (1.48) | 12.8 (1.60) |
| 2 | 8.7 (1.78) | 7.7 (1.73) | 7.7 (1.61) | 12.7 (1.74) |
| 3a | 9.0 (2.00) | 8.0 (1.98) | 8.4 (1.99) | 13.1 (2.01) |
| 3b | 9.5 (1.93) | 8.5 (1.91) | 8.9 (1.88) | 13.7 (2.07) |
| 4 | 9.9 (2.09) | 8.7 (2.07) | 9.2 (1.87) | 14.3 (2.07) |
| 5 | 11.2 (2.22) | 9.7 (2.16) | 10.6 (2.06) | 15.8 (2.25) |
Figure 1:
AG in different CKD stages in mEq/l, uncorrected and corrected for albumin, inorganic phosphate, and potassium, mean ± SD.
The prevalence of an elevated AG was highest in CKD stage 5 with 28 of 95 samples (29.5%).
Chloride, bicarbonate, and hyperchloraemic acidosis
There was an increase in serum chloride in CKD stage 5 with a mean [Cl−] of 107.6 ± 4.3 mEq/l compared to 105.0 ± 2.5 mEq/l in CKD stage 1 (Fig. 2), P < 0.001. [Cl−] in CKD stage 5 was higher than in any other stage, P < 0.001. There were no significant differences between CKD stages 1 to 4.
Figure 2:
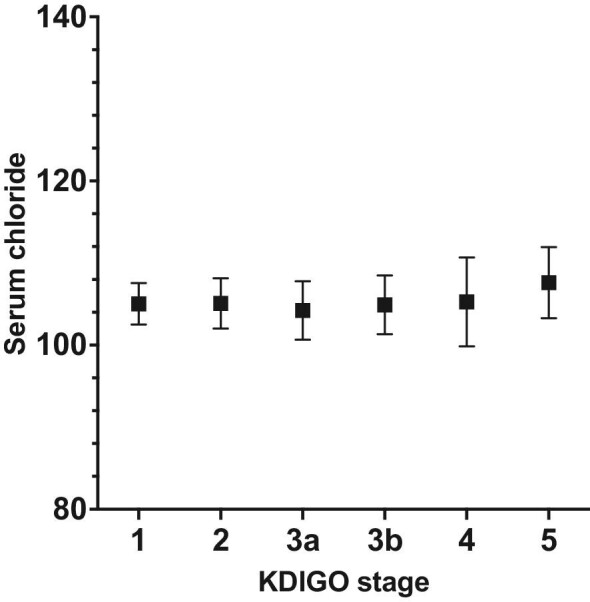
Serum chloride in mEq/l in different CKD stages, mean ± SD.
The serum [HCO3−] decreases with increasing CKD stage (Fig. 3), with a mean serum [HCO3−] of 27.7 mEq/l (±2.68) in CKD stage 1 and 22.6 mEq/l (±3.43) in CKD stage 5 (P < 0.001). Compared to CKD stage 1, [HCO3−] is lower in CKD stage 4 and 5 (P < 0.001).
Figure 3:
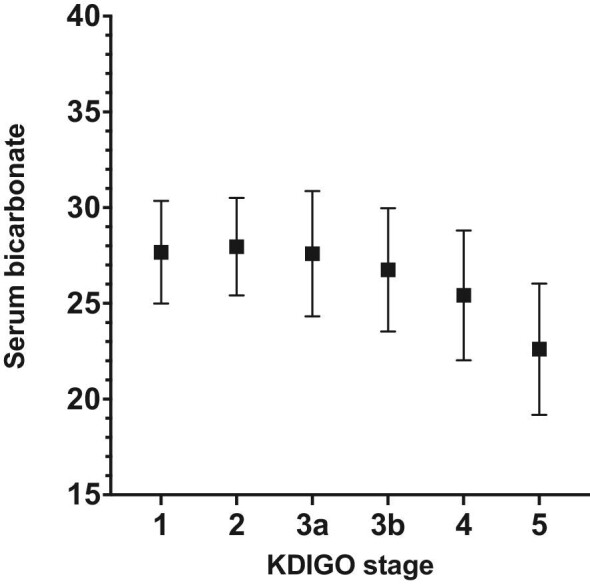
Serum bicarbonate in mEq/l in different CKD stages, mean ± SD.
In total 178 of 1045 (17.0%) samples showed a metabolic acidosis, defined as [HCO3−] < 24 mEq/l. In 36 of 178 samples (20.2%) we found a high AG and 125 of 178 samples (70.2%) had hyperchloraemia ([Cl−] >107 mEq/l). 17 of 178 (9.6%) had both a high AG and hyperchloraemia, and 34 of 178 (19.1%) had neither.
The difference between ∆HCO3−and ∆AG, showed an increase over the course of worsening renal function (Fig. 4), P < 0.001.
Figure 4:
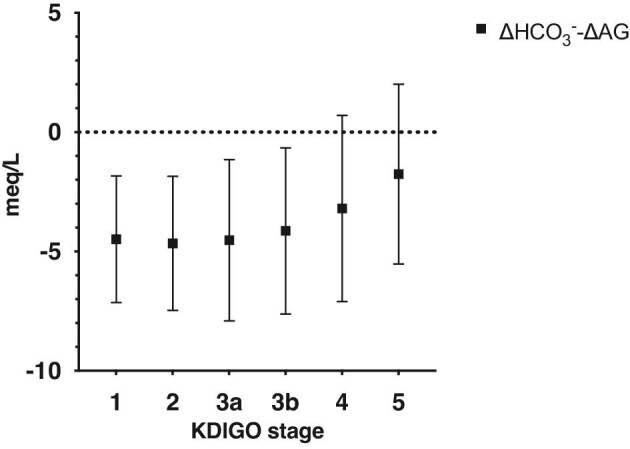
∆HCO3−-∆AG in different CKD stages, representing the magnitude of decrease in bicarbonate, that cannot be explained by an increase in the anion gap, mean ± SD.
The changes in AG, [Cl−], and [HCO3−] according to CKD stage are summarized in Fig. 5.
Figure 5:
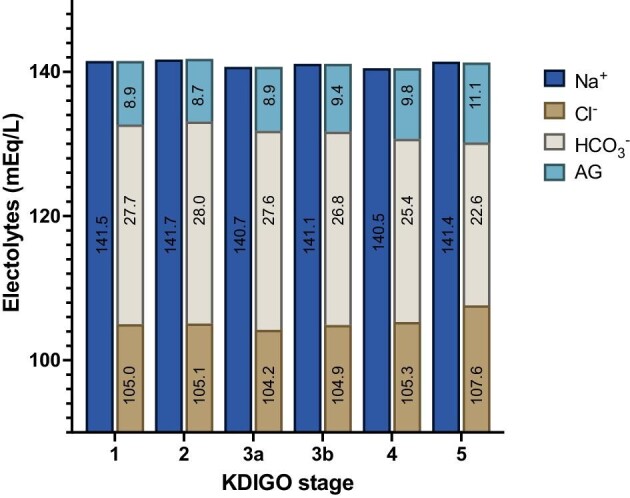
Overview over the course of mean AG, chloride, and bicarbonate in different CKD stages in mEq/l.
AG corrected for albumin
Correction for albumin slightly decreased the mean AG in all CKD stages (Table 3, Fig. 1). The elevation of the AG between CKD stage 1 and 5 was comparable to the uncorrected AG, with an albumin corrected AG of 7.8 mEq/l in CKD stage 1 and 9.7 mEq/l in CKD stage 5.
AG corrected for phosphate
In CKD stage 5, the mean serum phosphate level is 1.15 mg/dl (0.37 mEq/l) higher than in CKD stage 1, 4.28 ± 1.10 mg/dl (1.38 ± 0.19 mEq/l), and 3.13 ± 0.60 mg/dl (1.01 ± 0.36 mEq/l), respectively.
Adjusting for inorganic phosphate (AGph) results in a minimal decrease in the differences in AG in the different stages (Table 3, Fig. 1). The AGph increased from 7.7 (±1.48) mEq/l in stage 1 and 10.6 (±2.06) mEq/l in stage 5 (P < 0.001).
Correction for inorganic phosphate did not alter the prevalence of a high AG.
AG corrected for potassium
The mean [K+] increased in higher CKD stages, with a mean [K+] of 3.9 mEq/l (±0.26) in CKD stage 1 and 4.6 mEq/l (±0.54) in CKD stage 5, P < 0.001 (Table 3, Fig. 1).
After correction for [K+] the AG, increased by 3.0 mEq/l between stage 1 and stage 5, with an AG of 12.8 (±1.60) in stage 1 and 15.8 (±2.25) in CKD stage 5.
Correcting the AG for [K+] increased the prevalence of HAGMA by 5.8% overall, with 56 of 965 samples having an additional elevation of the AG instead of NAGMA alone. The mean [K+] in these samples was 4.7 mEq/l (±0.46) and consisted of 19 samples (33.9%) from patients with CKD stage 4, and 23 (41.1%) with CKD stage 5.
Other electrolytes
All results and changes in routinely measured electrolytes are summarized in Figs. 5 and 6. The most pronounced alterations with progressive renal failure are the differences in [Cl−], [HCO3−], and the AG.
Figure 6:
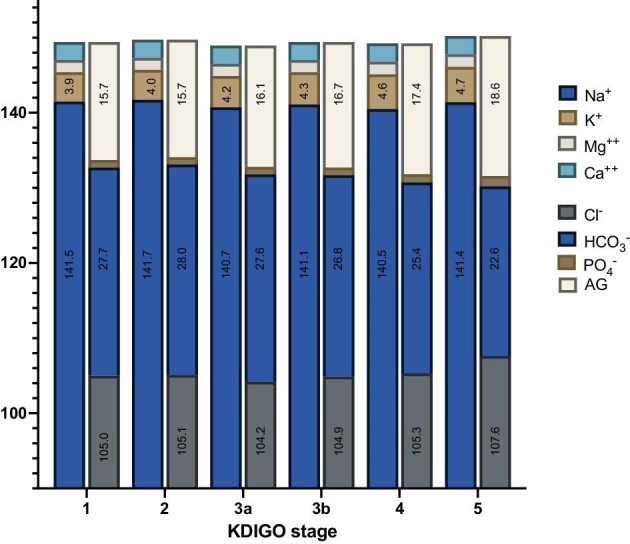
Overview over the course of mean electrolytes in different CKD stages (mEq/l) and the AG considering all routinely measured electrolytes. The value of most prevalent anions and cations are shown in the figure.
AG and protein intake
Patients with advanced CKD had significantly lower estimated protein intake, as estimated by 24 h of urine urea excretion, with a mean daily protein intake of 1.04 (±0.26) g/kg/day in CKD stage 1, and 0.80 (±0.23) g/kg/day in CKD stage 5, and <0.001.
In a composite of CKD stages 4 and 5, the daily protein intake did not alter the AG, with a mean AG of 10.4, 10.2, and 10.0 mEq/l, in patients with low, normal, and high protein intake, respectively, P = 0.61, see Table 4.
Table 4:
AG, Cl−, HCO3− with low (<0.8 g/kg/day), normal (0.8–1.2 g/kg/day), and high (>1.2 g/kg/day) protein intake in CKD stages 4 and 5 combined.
| AG (SD) | Cl− (SD) | HCO3− (SD) | |
|---|---|---|---|
| Low | 10.4 (2.15) | 106.0 (5.69) | 24.8 (3.80) |
| Normal | 10.2 (2.05) | 106.3 (4.73) | 24.3 (3.39) |
| High | 10.0 (1.73) | 105.0 (4.82) | 25.1 (3.29) |
Protein intake did not alter [Cl−], with 106.0 (±5.67) mEq/l, 106.3 (±4.73) mEq/l, and 105.0 (±4.82) mEq/l in low, normal, and high protein intake, respectively (P = 0.54), see Table 4.
There were no alterations in [HCO3−], with [HCO3−] of 24.7 (±3.80) mEq/l, 24.3 (±3.39) mEq/l, and 25.1 (±3.29) mEq/l in low, normal, and high protein intake, respectively (P = 0.46) (Table 4).
Protein intake in CKD 4 and 5 did not alter ∆HCO3−-∆AG, with a ∆ of −3.2 (±4.07) in low protein intake, −2.5 (±3.77) in normal protein intake, and −3.0 (±3.10) in high protein intake.
Strong ion difference and strong ion gap
In advanced CKD, there was a decrease in aSID between CKD stages 1 and 5, with an aSID of 42.5 mEq/l in CKD stage 1 to 40.4 mEq/l in CKD stage 5 (P < 0.001).
The eSID decreased from 41.3 mEq/l in CKD stage 1 to 35.9 mEq/l in CKD stage 5 (P < 0.001). Compared to CKD stage 1 there was a decrease in eSID in CKD stage 3b and higher.
There was an increase in the SIG in higher CKD stages (Table 5), from 1.27 mEq/l in CKD stage 1 and 4.55 mEq/l in CKD stage 5, representing unmeasured anions (P < 0.001), with a significant difference between CKD stage 1 and CKD stage 3a and higher.
Table 5:
aSID, eSID, and SIG in different CKD stages (mEq/l).
| CKD stage | aSID (SD) | eSID (SD) | SIG (SD) |
|---|---|---|---|
| 1 | 42.5 (2.75) | 41.3 (2.79) | 1.27 (1.52) |
| 2 | 42.8 (2.71) | 41.3 (2.71) | 1.50 (1.45) |
| 3a | 42.7 (3.09) | 40.5 (3.26) | 2.13 (1.60) |
| 3b | 42.0 (3.45) | 39.4 (3.46) | 2.60 (1.66) |
| 4 | 41.7 (3.99) | 38.5 (3.69) | 3.19 (1.78) |
| 5 | 40.4 (3.40) | 35.9 (3.48) | 4.45 (1.67) |
There is a positive correlation between the AG and the SIG (R2 = 0.577), as shown in Fig. 7.
Figure 7:
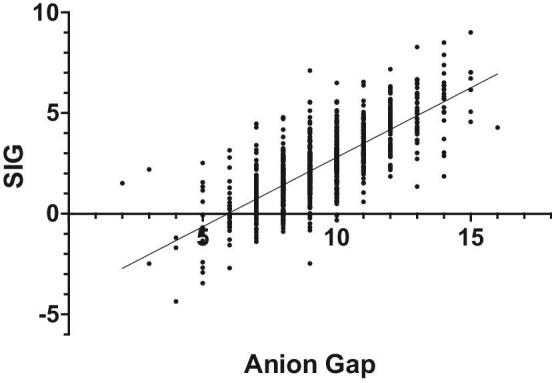
Correlation between AG and SID.
DISCUSSION
In this observational study we assessed the AG, [Cl−], and [HCO3−] in steady state CKD in the outpatient clinic. We found a limited increase in AG in advanced renal failure. Furthermore, we found that correction for phosphate, albumin, or potassium, did not substantially alter the AG. Finally, we found that the decrease in [HCO3−] was clearly more pronounced than the increase in AG in worsening renal failure, reflection the major contribution of hyperchloraemic acidosis.
Our data indicate limited accumulation of unmeasured anions and in a minority of patients with CKD stage 4 and 5, leading to a maximum AG of 15 mEq/l in these stages.
Hypoalbuminaemia was uncommon. Even though correction for albumin lowered the overall AG, it did not significantly alter the course and cannot explain the overall increase in AG. Routine correction is futile, but in pronounced hypoalbuminaemia correction could be considered.
Accumulation of inorganic phosphate can theoretically be contributing to the elevation of the AG in CKD stage 5. Although hyperphosphataemia is an established complication of CKD [14], in our cohort the mean phosphate concentration in CKD stage 5 is still within normal limits. Because the increase in serum phosphate in steady state CKD is relatively limited, it is only a small component of the unmeasured anions. Correction for phosphate did not significantly alter the results and did not influence prevalence of HAGMA and is therefore not useful. In extreme hyperphosphataemia, it could still be a contributing factor.
Urate, sulphate, and hippurate have been proposed as potential unmeasured anions [9, 13]. Because only routine laboratory tests were measured, these anions were not assessed in our cohort.
Serum [K+] is known to increase in CKD and can influence the AG. Because of the practicality of the more straightforward formula, the AG is not routinely corrected for [K+].
Markedly elevated [K+] could obscure accumulated unmeasured anions. Without correction for [K+] the AG could be underestimated. Correction for [K+] increases the prevalence of an elevated AG in stage 4 and 5 CKD in our cohort. However, more importantly, the magnitude of the increase is still limited to a mean increase of 3 mEq/l and a maximum increase of 4 mEq/l above the normal range. This is comparable to the increase without correction for [K+] and therefore correction does not seem to be clinically relevant. In patients with more pronounced [K+] the contribution might be more relevant. Considering the normal values of [K+] hyperkalaemia will only increase the AG by mostly a few mEq/l.
The decrease in [HCO3−] in advanced CKD stages was more pronounced than the increase in AG, which implies another factor contributing to the acidosis than accumulation of non-volatile acids alone, suggesting an important role of NAGMA. This is also represented by an increase in ∆HCO3−-∆AG over the course of worsening renal failure. More pronounced, the dominant role of NAGMA is supported by the prevalence of hyperchloraemia in patients with [HCO3−] <24 mEq/l, which is substantially more prevalent than a high AG in the same group.
High protein intake leads to a relevant acid production and might influence the acid–base balance, when the renal acid excretion is reduced. However, protein intake did not influence the AG in steady state CKD. We found a lower protein intake in CKD stage 5, presumably due to anorexia in end stage renal failure or due to low protein diet as part of the CKD treatment. The absence of a high AG was expected, because protein intake increases the overall acid load, which is buffered by HCO3−. This would be compensated by an increase in [Cl−]. This theoretically leads to NAGMA, even in limited CKD, where the acid excretion can be affected.
However, in patients with CKD stage 4 and 5 combined, the protein intake did not significantly influence the [HCO3−] or [Cl−] either. The ∆HCO3−-∆AG was not influenced by protein intake, suggesting limited influence of protein intake on the metabolic acidosis.
The increase in SIG represents the accumulation of unmeasured anions in worsening renal function. We found a limited increase of the SIG between CKD stage 1 and stage 5, suggesting limited accumulation of unmeasured anions.
The increase was significant between CKD 1 and stage 3a and higher, which is in lower CKD stages than the increase in the AG and is therefore more sensitive. It suggests an early elevation and accumulation of anions, not measured by the AG. This effect might arise from measuring factors that are accounted for in the SIG and not in the AG, like magnesium, calcium, inorganic phosphate, and albumin.
There was a high positive correlation between the unmeasured anions calculated by the AG and the SIG, which shows that AG seems to be an accurate method of evaluating the unmeasured anions, even though it can be considered less sensitive.
We could not identify the explanation of why the increase in AG was so limited. We expected the increase to be higher, based on previous studies [8]. We hypothesize that there could be an augmented clearance of unmeasured anions in steady state renal failure, but there was insufficient data in routine urine samples to substantiate this hypothesis. It would be interesting to analyse the AG and relevant electrolytes in the urine to further examine this theory.
Presumably, this could mean that augmented clearance would not be present or insufficient in acute kidney injury or critical illness and might lead to an elevated AG in these circumstances, also with the same creatinine clearance as in our cohort.
This study shows the limited increase in AG in documented steady state renal failure.
We acknowledge some limitations. First, all patients are included in the outpatient renal clinic, where they presented for various reasons. Patients with CKD stage 1 were part of the control group for pragmatic reasons and consisted mainly of patients with adeno-associated virus and proteinuria. Therefore, they do not necessarily represent a healthy population. However, we did not find any evidence of acid–base disorders in patients with adeno-associated virus, which was a large portion of the group with preserved renal function.
Second, we acknowledge that our data does not represent patients with acute illness. The increased AG in known CKD might be more outspoken in acute illness, as metabolic stress will be increased.
Finally, there could be a selection bias in patients with CKD stage 5. We excluded haemodialysis patients. Potentially, we excluded patients with uremic syndrome and presumably the highest concentrations of uremic solutes and unmeasured anions. This was inevitable because of the influence of dialysis on the acid–base balance; however, we did include patients with pre-dialysis care.
It would be interesting to see what changes in [HCO3−], [Cl−], AG, and SIG are encountered in anuric haemodialysis patients that lack any possible renal compensation.
CONCLUSION
This study highlights the importance of considering both the CKD stage and the magnitude of the AG in the evaluation of patients with HAGMA. The limited elevation of AG in steady state CKD patients, as compared to the decrease in [HCO3−], suggests that normal AG metabolic acidosis may play a critical role in the acid–base disturbances observed in these patients.
While it is plausible to correct for phosphate, albumin, or potassium, our findings indicate that only potassium correction slightly increases the prevalence of elevated AG. Notably, an AG >15 mEq/l is uncommon in the absence of other contributing factors, and renal failure alone is unlikely to account for such elevations.
Contributor Information
Hendrik W Zijlstra, Department of Intensive Care, University of Groningen, University Medical Center Groningen, Groningen, The Netherlands.
Coen A Stegeman, Department of Nephrology, University of Groningen, University Medical Center Groningen, Groningen, The Netherlands.
DATA AVAILABILITY STATEMENT
The data that support the findings of this study are available from the corresponding author, HWZ, upon reasonable request.
Conflict of interest statement
None declared.
REFERENCES
- 1. Kraut JA, Kurtz I.. Metabolic acidosis of CKD: diagnosis, clinical characteristics, and treatment. Am J Kidney Dis 2005;45:978–93. 10.1053/j.ajkd.2005.03.003 [DOI] [PubMed] [Google Scholar]
- 2. Kraut JA, Madias NE.. Serum anion gap: its uses and limitations in clinical medicine. Clin J Am Soc Nephrol 2007;2:162–74. 10.2215/CJN.03020906 [DOI] [PubMed] [Google Scholar]
- 3. Emmett M, Narins RG.. Clinical use of the anion gap. Medicine (Baltimore) 1977;56:38–54. 10.1097/00005792-197756010-00002 [DOI] [PubMed] [Google Scholar]
- 4. Scialla JJ, Anderson CAM.. Dietary acid load: a novel nutritional target in chronic kidney disease? Adv Chronic Kidney Dis 2013;20:141–9. 10.1053/j.ackd.2012.11.001 [DOI] [PMC free article] [PubMed] [Google Scholar]
- 5. Sebastian A, Frassetto LA, Sellmeyer D Eet al. . Estimation of the net acid load of the diet of ancestral preagricultural Homo sapiens and their hominid ancestors. Am J Clin Nutr 2002;76:1308–16. 10.1093/ajcn/76.6.1308 [DOI] [PubMed] [Google Scholar]
- 6. Kim HJ. Metabolic Acidosis in Chronic Kidney Disease: Pathogenesis, Clinical Consequences, and Treatment. Electrolyte Blood Press. 2021;19:29–37. [DOI] [PMC free article] [PubMed] [Google Scholar]
- 7. Sabatini S. The acidosis of chronic renal failure. Med Clin North Am 1983;67:845–58. 10.1016/S0025-7125(16)31181-6 [DOI] [PubMed] [Google Scholar]
- 8. Pourafshar N, Pourafshar S, Soleimani M.. Urine ammonium, metabolic acidosis and progression of chronic kidney disease. Nephron 2018;138:222–8. 10.1159/000481892 [DOI] [PubMed] [Google Scholar]
- 9. Wallia R, Greenberg A, Piraino Bet al. . Serum electrolyte patterns in end-stage renal disease. Am J Kidney Dis 1986;8:98–104. 10.1016/S0272-6386(86)80119-6 [DOI] [PubMed] [Google Scholar]
- 10. Yildirim I, Hur E, Magden Ket al. . Serum sulphate levels in hemodialysis patients. Int J Nephrol 2019;2019:1. 10.1155/2019/1063514 [DOI] [PMC free article] [PubMed] [Google Scholar]
- 11. Duranton F, Cohen G, De Smet Ret al. . Normal and pathologic concentrations of uremic toxins. J Am Soc Nephrol 2012;23:1258–70. 10.1681/ASN.2011121175 [DOI] [PMC free article] [PubMed] [Google Scholar]
- 12. Igarashi P, Gulyassy P, Stanfel Let al. . Plasma hippurate in renal failure: high-performance liquid chromatography method and clinical application. Nephron 1987;47:290–4. 10.1159/000184526 [DOI] [PubMed] [Google Scholar]
- 13. Abramowitz MK, Hostetter TH, Melamed ML.. The serum anion gap is altered in early kidney disease and associates with mortality. Kidney Int 2012;82:701–9. 10.1038/ki.2012.196 [DOI] [PMC free article] [PubMed] [Google Scholar]
- 14. Hruska KA, Mathew S, Lund Ret al. . Hyperphosphatemia of chronic kidney disease. Kidney Int 2008;74:148–57. 10.1038/ki.2008.130 [DOI] [PMC free article] [PubMed] [Google Scholar]
Associated Data
This section collects any data citations, data availability statements, or supplementary materials included in this article.
Data Availability Statement
The data that support the findings of this study are available from the corresponding author, HWZ, upon reasonable request.


