Figure 4:

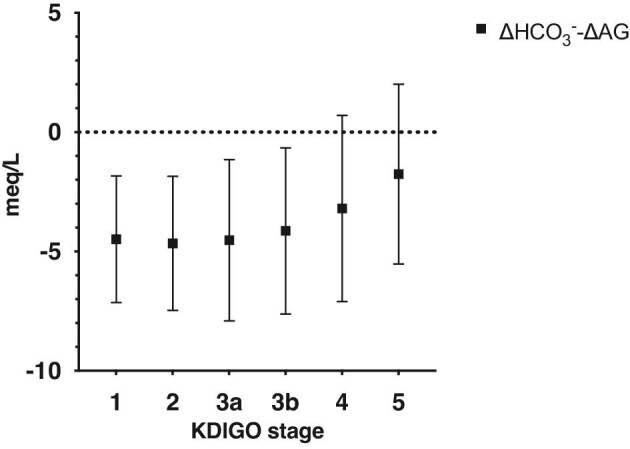
∆HCO3−-∆AG in different CKD stages, representing the magnitude of decrease in bicarbonate, that cannot be explained by an increase in the anion gap, mean ± SD.

∆HCO3−-∆AG in different CKD stages, representing the magnitude of decrease in bicarbonate, that cannot be explained by an increase in the anion gap, mean ± SD.