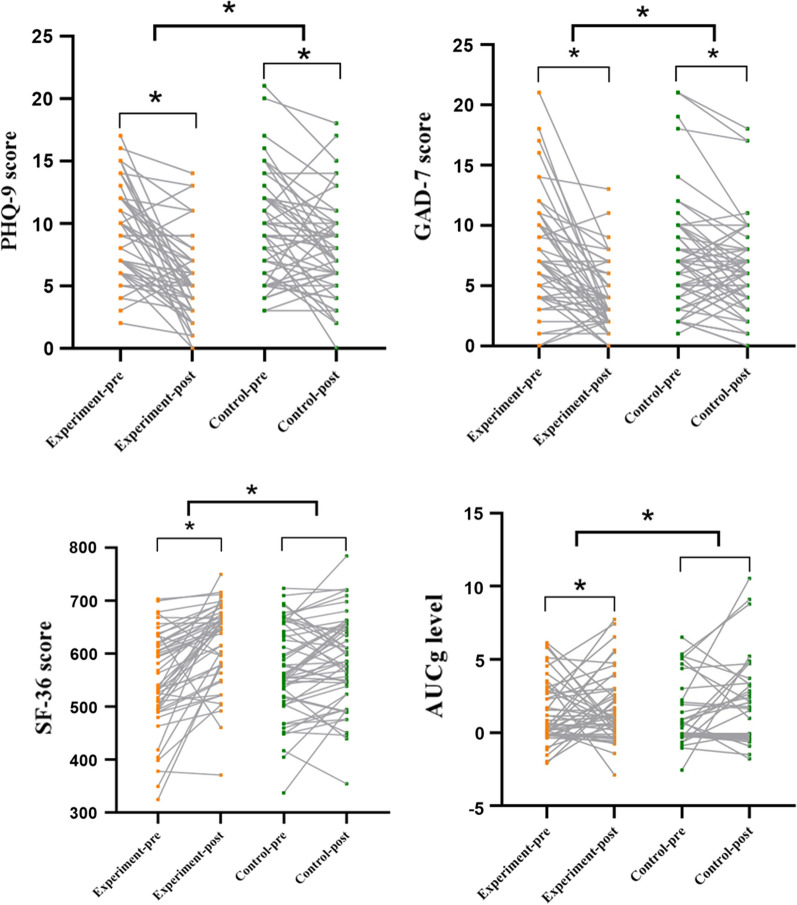
Fig. 1.
Top left: The PHQ-9 scores in the experimental group (P = 0.001 < 0.01) and in the control group (P = 0.012 < 0.05) were also significant. Upper right: The GAD-7 score decreased significantly after training in both the Tai Chi (P = 0.001 < 0.01) and the control group (P = 0.018 < 0.05). Bottom left: SF-36 in the experimental group increased significantly after training (P = 0.001 < 0.01) but was not significant in the control group (P = 0.053 > 0.05). Bottom right: The AUCg of the experimental group decreased significantly after training (P = 0.005 < 0.01) but it was not significant in the control group (P = 0.785 > 0.05). Each data point represents the value of a participant. Next to each arrow is the confidence interval (CI) for each effect. *P < 0.05. Notes: AUCg: area under the curve relative to the ground; GAD-7: Generalized Anxiety Disorder Scale; PHQ-9: Patient Health Questionnaire; and SF-36: the medical outcomes study 36-item short-form health survey

