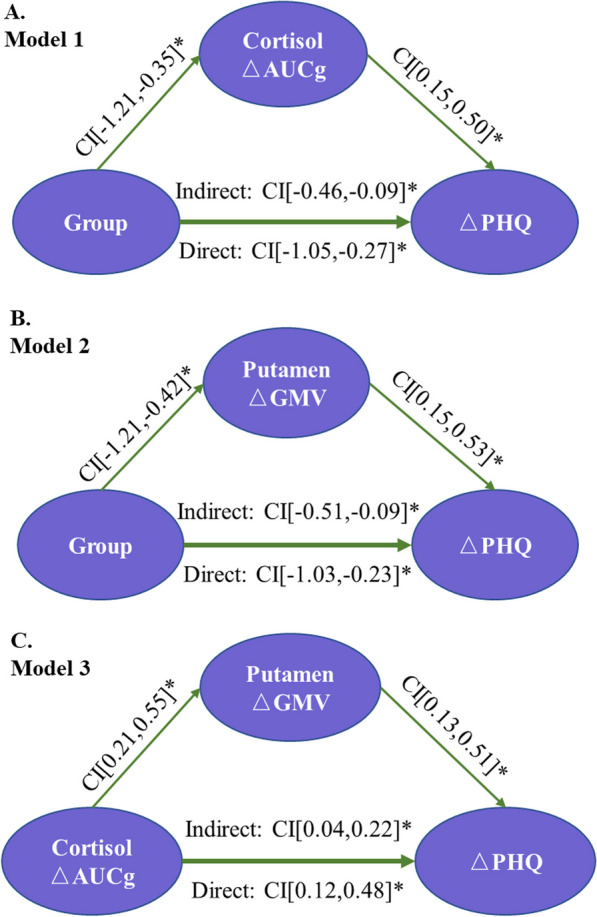
Fig. 3.

Diagram of the mediation model. A (Model 1): Group was the independent variable (experimental = 1 and control = 0). ΔAUCg was the mediator variable, and ΔPHQ was the dependent variable. B (Model 2): Group was the independent variable (experimental = 1 and control = 0). ΔGMV was the mediator variable, and ΔPHQ was the dependent variable. C (Model 3): ΔAUCg was the independent variable, ΔGMV was the mediator variable, and ΔPHQ was the dependent variable. Notes: AUCg: area under the curve relative to the ground; GMV: gray matter volume; and PHQ-9: Patient Health Questionnaire
