Fig. 7.
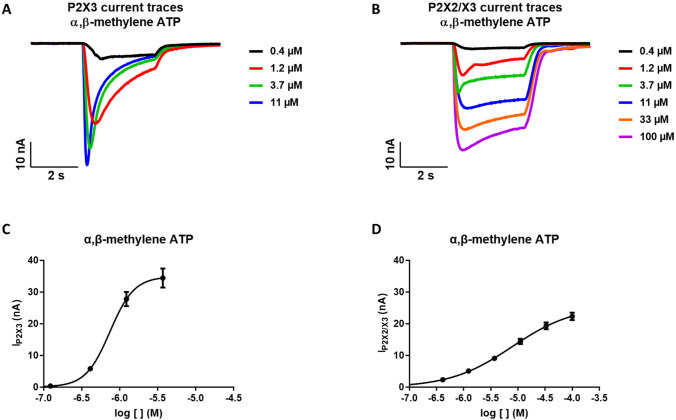
A, B: Representative traces of P2X3R-current and P2X2/3R-current evoked by increasing concentrations of the reference agonist α,β-methylene ATP. C: Fitting of the average (mean ± SE) of the dose response curves of α,β-methylene ATP for P2X3R (LogEC50 6.13 ± 0.05, n = 28). D: Fitting of the average (mean ± SE) of the dose response curves of α,β-methylene ATP for P2X2/3R (LogEC50 5.11 ± 0.11, n = 36)

