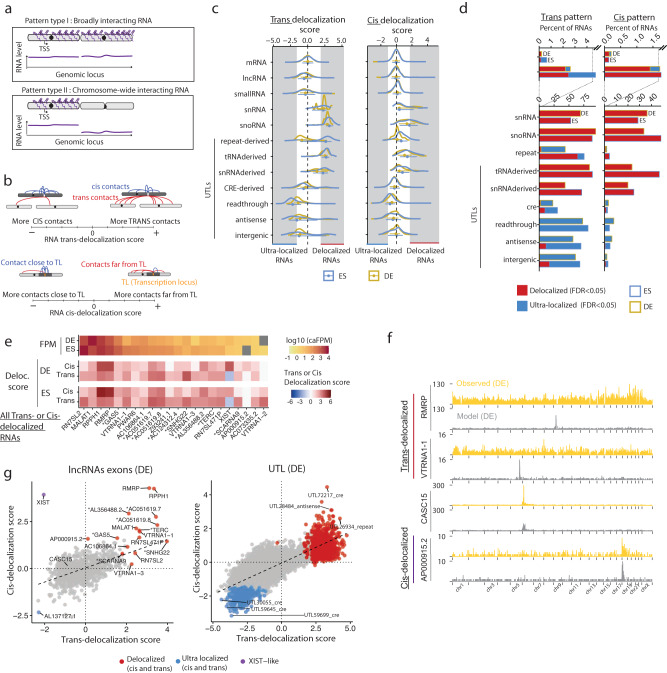
Fig. 4. A select population of caRNAs interacts with the genome broadly.
a Schematic of the two types of binding patterns identified in this analysis: type I RNAs localized across the genome (trans-delocalized RNAs), type II RNAs localized throughout their source chromosome but absent on other chromosomes (cis-delocalized RNAs). b Schematic definition of the trans- and cis-delocalization scores. The trans-delocalization score quantifies the number of DNA contacts an RNA makes on chromosomes other than its source chromosome (trans-contacts) relative to the number of contacts on its source chromosome (cis-contacts). The cis-delocalization score quantifies the number of DNA contacts an RNA makes over 10 Mb away from its transcription locus (TL) relative to the number of contacts within 10 Mb of its TL. c Distribution of trans- (left) and cis- (right) delocalization scores (geometric mean over 2 independent replicates per cell state) and by class of RNA for exons (n = 23,436 RNAs) and UTLs (n = 19,069 RNAs). Error bars represent the median and 25–75% quartiles. d Fraction of RNAs within each class identified as either delocalized or ultralocalized in regard to its trans- (left) or cis-chromosomal contacts (right). e List of all lncRNAs identified as cis or trans-delocalized in either ES or DE cells and candidate RNAs for type I or type II patterns. Heat maps show the RNA cis and trans-delocalization scores in ES and DE cells and their abundance in the caRNA population. f Chromatin interaction profiles for two examples of cis-delocalized RNAs (RMRP, VTRNA1-1), one example of cis-delocalized RNAs (AP000915.2), and one non-delocalized RNA (CASC15). The yellow track shows the observed ChAR-seq signal. The gray track shows the predicted interaction profile based on the generative model with trans-contact rate prediction, as described in Fig. 5 and Supplementary Note 4. g Scatter plot showing the cis- versus trans-delocalization score for individual lncRNAs in ES cells (left) and UTLs in DE cells (right, excludes tRNA-derived and snRNA-derived UTLs). Colored data points indicate RNAs classified as delocalized (in either cis or trans), ultralocalized (in both cis and trans), and RNAs with XIST-like behavior. The black line shows the linear regression output.

