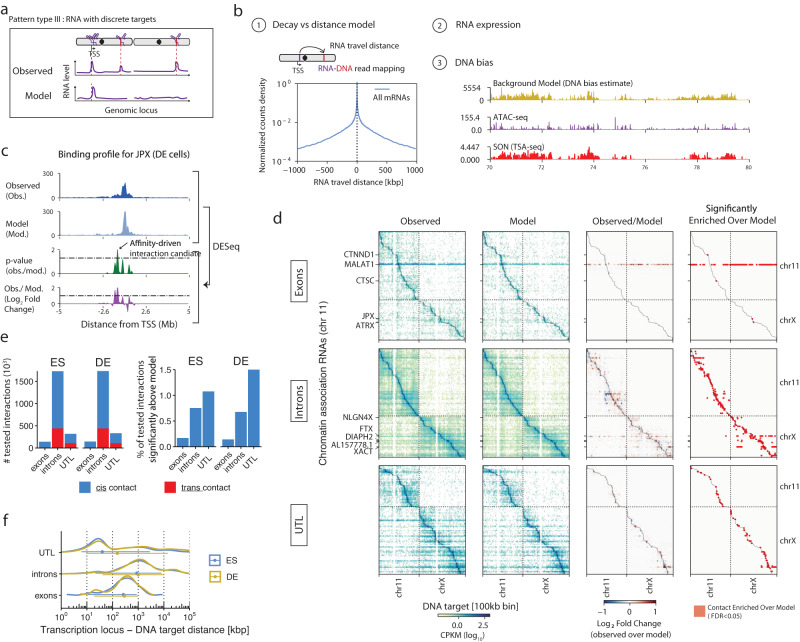
Fig. 5. RNA expression and genomic distance determine the RNA-DNA interactome.
a Schematic of the type of binding patterns identified in this analysis. An RNA may localize at one or more discrete loci distinct from its transcription site (Pattern type III, top track) or remain in a diffusion-constrained region around its locus (neutral RNA, bottom track). b Components of the generative model used to predict the ChAR-seq maps. The number of contacts observed for an RNA at a DNA locus is proportional to (1) an RNA-DNA distance-dependent contact frequency, (2) the abundance of the RNA on chromatin, (3) a target locus-dependent bias (DNA-bias, yellow track), which correlates with both ATAC-seq signal (purple track) and nuclear speckle proximity signal (TSA-seq, red track). c Example of a type III pattern with a candidate affinity-driven interaction for the lncRNA JPX in DE cells. The observed and predicted localization of JPX (top two tracks) at 10 kb resolution and are compared using DESeq2, yielding a Log2 fold change (observed over model) and an adjusted p-value track (bottom two tracks). Interactions with an LFC greater than 1.3 and an adjusted p-value smaller than 0.05 are labeled as candidate affinity-driven interaction. d Observed contact maps, predicted contact maps, and observed over model LFC maps computed using DESeq2 for the top 200 most abundant RNAs originating from exons (top), introns (middle) and UTLs (bottom). x-axis resolution is 100 kb per bin; y-axis resolution is 1 RNA per bin. Only interactions with at least 10 counts in at least two samples were tested for differences with the model and are shown in the LFC maps. e Number of interactions tested for enrichment over model and proportion of identified candidate affinity-driven interactions by RNA class, in relation to the total number of tested interactions in that RNA class. f Distribution of the RNA-DNA travel distance for interactions significantly above model (n = 33,653 interactions). Error bars represent the median and 25–75% quartiles. The RNA-DNA travel distance is calculated using the mapping coordinates of the RNA and DNA side of the ChAR-seq read (“Methods”).

