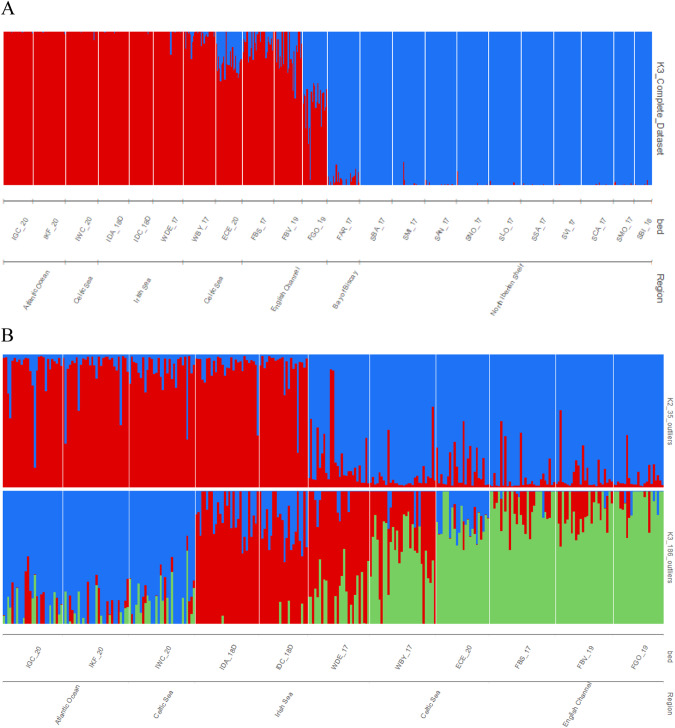
Fig. 2. Population structure of Cerastoderma edule at different geographical scales using fastSTRUCTURE.
Each vertical bar represents one individual, and the colour proportion of each bar represents the posterior probability of assignment of each individual to the different clusters (K) inferred by the programme. The most likely K = 3 using the whole dataset (A), and K = 2 using the 35 shared divergent outliers between methodologies and K = 3 using the total 186 divergent outliers (B) for the SW British Isles are represented. Codes are shown in Table 1. Plots for all the K values tested for the different datasets are shown in Supplementary Figures.

