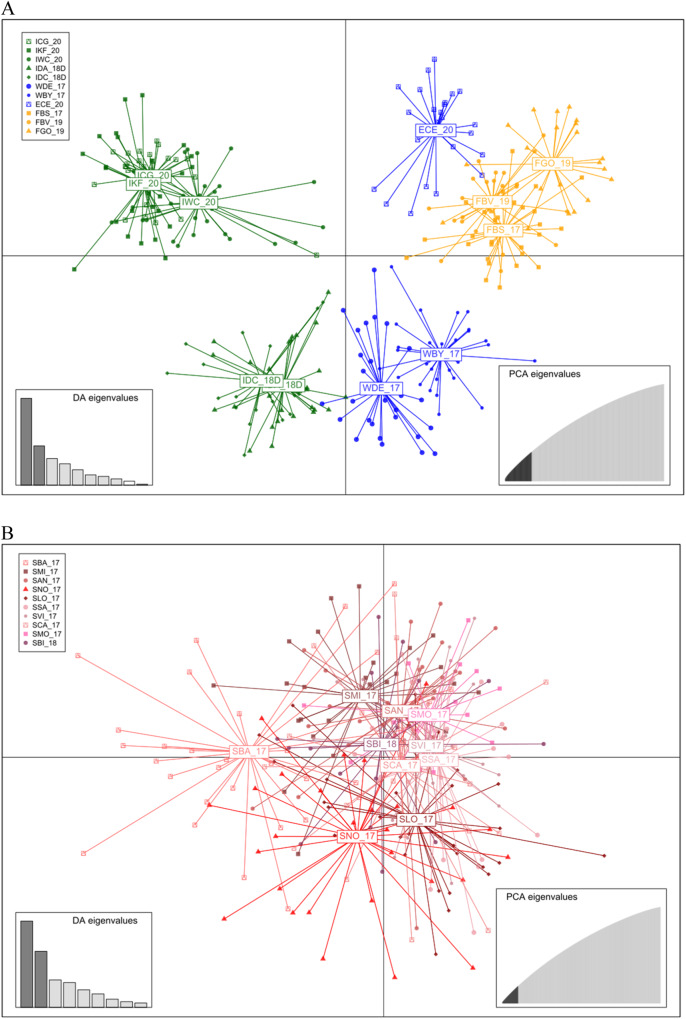
Fig. 3. Representation of discriminant analysis of principal components (DAPC) results using complete SNP datasets.
DAPC plots of Cerastoderma edule beds belonging to the SW British Isles (A) and Galicia (B) are shown. The weight of retained discriminant analysis (DA) and principal components selected are shown on left bottom box and right bottom box, respectively. Codes are shown in Table 1.

