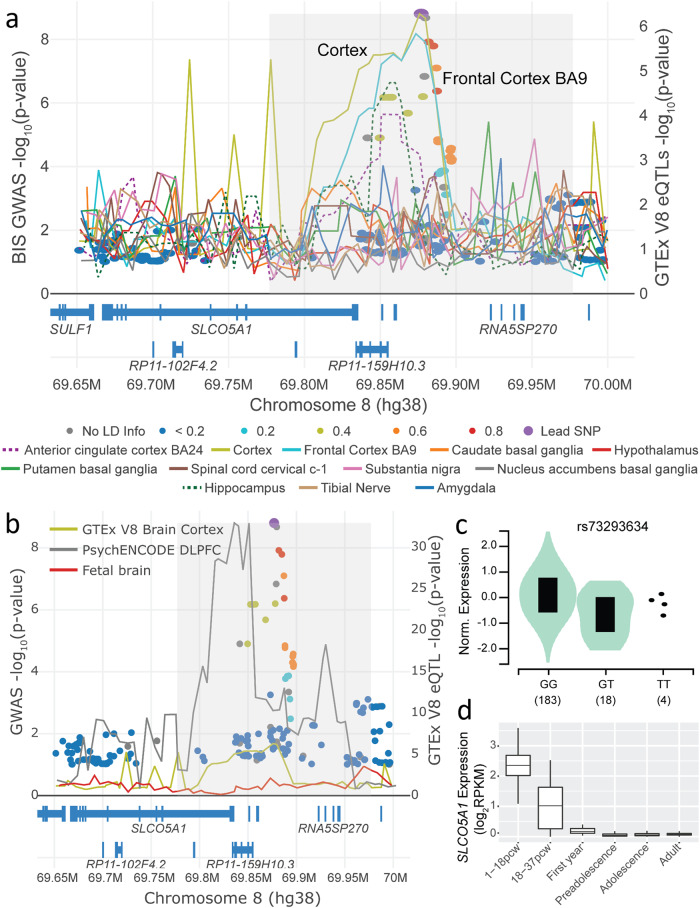
Fig. 2. LocusFocus70 plot for the GWAS with BIS-Brief in JME (circles) and eQTLs in GTEx12 brain and tibial nerve tissues for the SLCO5A1 gene (lines).
The Simple Sum 236 and COLOC269 colocalization methods implemented in LocusFocus (v1.4.9)70 were used to test for colocalization of the BIS-Brief genome-wide peaks with eQTL analyses brain tissues from GTEx v812, PsychENCODE34, and fetal brain35. a Colocalization figure from LocusFocus for the SLCO5A1 gene. Lines depict the minimum P value trace in a sliding window for SLCO5A1 eQTLs from GTEx, one line per tissue. Circles depict the GWAS with BIS-Brief, with the lead SNP in purple and pairwise LD with the lead SNP marked as shown in the legend, calculated using the 1000 Genomes Project60 European subset. Significant colocalization is observed for SLCO5A1 eQTLs in GTEx v8 for the cerebral cortex after increasing sample size in a mega-GWAS (n = 367, −log10 Simple Sum 236 P = 9.5 × 10⁻³). Colocalization analysis with only the Europeans is provided in Supplementary Fig. 7. Colocalization was also tested for all other nearby genes shown in the figure, but no other genes’ eQTLs colocalized with BIS-Brief GWAS (not shown). b Colocalization analysis with PsychENCODE eQTLs in the dorsolateral prefrontal cortex (DLPFC) (n = 1866)34, and eQTLs derived from second trimester fetal brains (n = 120)35, with GTEx’s brain cortex eQTL as in A provided for reference. Colocalization analysis results suggest no colocalization with either PsychENCODE (Simple Sum 2 P = 0.985) or fetal brain eQTLs (does not pass first stage test in Simple Sum 2 for having significant eQTLs in the region). c Violin plot for the eQTL effect of rs73293634 SNP on SLCO5A1 expression in the cerebral cortex from GTEx v8. d Expression change of SLCO5A1 from brains in various developmental stages from BrainSpan37,38. pcw, post conception weeks; preadolescence, 2–12 years old (inclusive); adolescence, 13–19 years old; adult, ≥20 years old (oldest samples are 40 years old). The centre lines represent the 50th percentile (median) and the bounds of the boxes are the 75th and 25th percentiles (interquartile range) with the whiskers being the largest value within 1.5 times the interquartile range above the 75th percentile and smallest values within 1.5 times the interquartile range below the 25th percentile.

