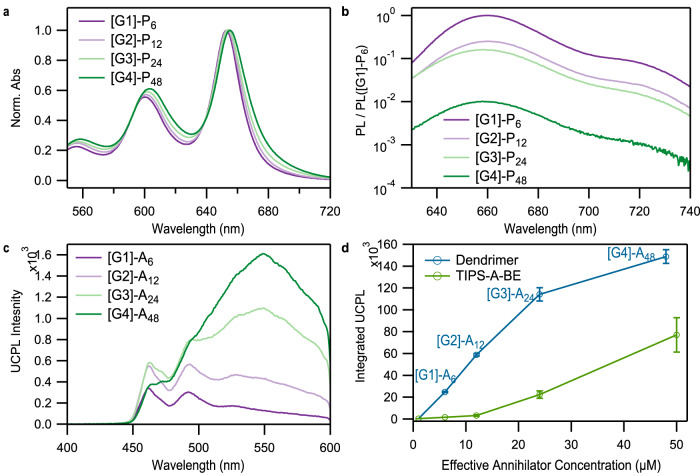
Fig. 2. Steady-state spectra of the dendrimers.
a Normalized absorption of the SF dendrimers [G1]-P6, [G2]-P12, [G3]-P24, and [G4]-P48 in the region corresponding to the transition. As the generation becomes larger, we observe a small red-shift of the peak maxima, enhanced NIR absorption, and an increase in the ratio between the 0–1 vibronic peak near 600 nm and the 0–0 vibronic peak near 654 nm. (b) The relative photoluminescence quantum yield (PLQY) decreases for larger generations, to 0.25 in [G2]-P12, 0.16 in [G3]-P24, and 0.01 in [G4]-P48 compared to [G1]-P6, consistent with the emergence of rapid singlet fission. The excitation wavelength used here was 590 nm. c Upconversion photoluminescence spectra of anthracene dendrimers measured at 1 µM with 50 µM PdTPTBP sensitizer in degassed chloroform with excitation at 635 nm and d values of UCPL intensity spectra integrated from 400 to 600 nm for anthracene dendrimers measured at 1 µM and analogous anthracene monomer, plotted against relative annihilator concentration. The error bars represent the standard deviations of the measured values (n = 3).

