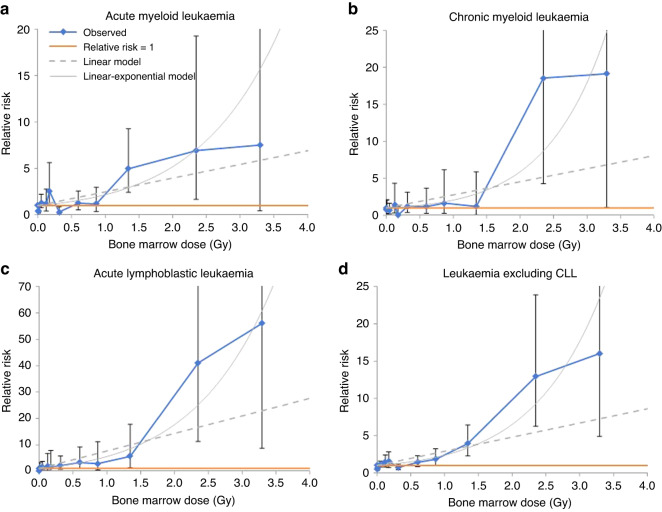
Fig. 1. Relative risk (and 95% CI) by mean whole-body-averaged cumulative active bone marrow dose by leukaemia subtype.
a Acute myeloid leukaemia (AML), b chronic myeloid leukaemia (CML), c acute lymphoblastic leukaemia (ALL) and d leukaemia excluding CLL. Solid red line gives relative risk = 1, dashed grey line the fitted linear relative risk model, with ERR/Gy taken from Table 2 and Appendix B Table B2, solid grey line the linear-exponential model, taken from Table 3 and Appendix B Table B4. Dose boundaries used for categories are 0, 0.005, 0.02, 0.10, 0.15, 0.20, 0.50, 0.75, 1.00, 2.00, 3.00 Gy.

