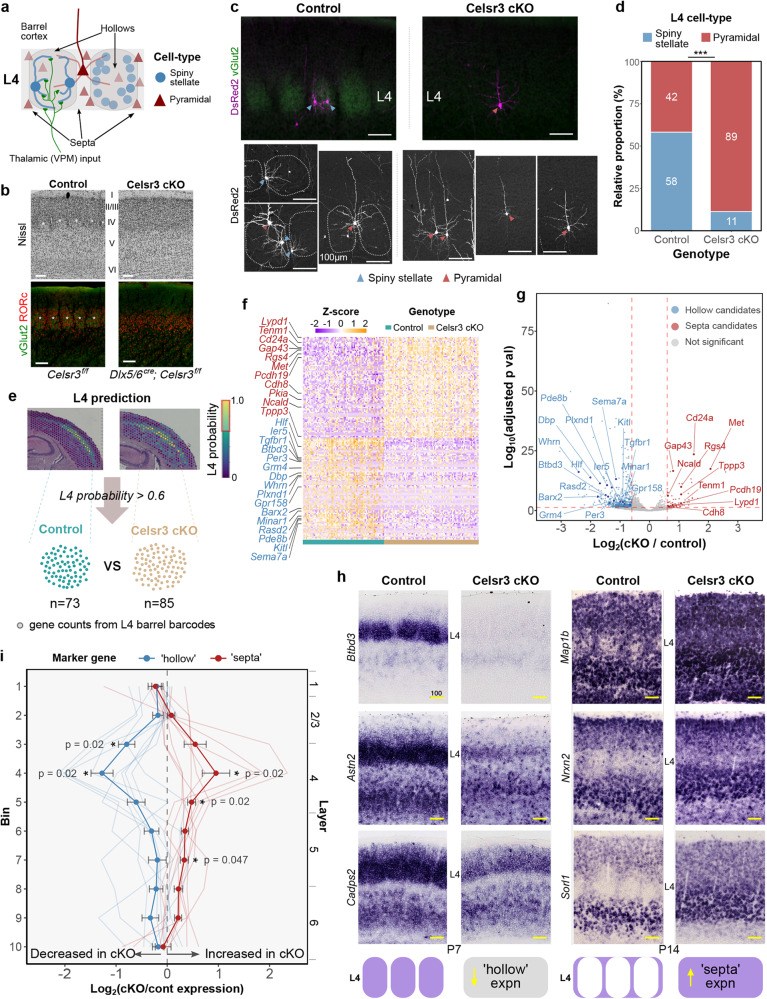
Fig. 1. Spatial transcriptomics profiling of stellate-less somatosensory cortex in Celsr3 cKOs.
a Schematic illustrating the cytoarchitecture of mouse L4 barrel cortex, depicting spiny stellate neurons (blue circles) in hollow and pyramidal neurons (red triangles) in septal compartments. b In Nissl and RORc-immunostained sections, barrel clusters (asterisks) are absent in Celsr3 cKO somatosensory cortex with no thalamocortical innervation (vGlut2 staining). c Top, widefield fluorescent images of L4 neurons in “barrel” cortex visualized by sparse DsRed2 labeling. Bottom, representative confocal images showing spiny stellate (blue arrowheads) and pyramidal (red arrowheads) morphologies. In controls, barrels were outlined using DAPI and vGlut2 staining of TCA input (dotted lines). d Quantification of spiny stellate and pyramidal neurons in L4 somatosensory cortex. Asterisks indicate ***p = 0.0002, generalized linear mixed-effects model with parametric bootstrap test (n = 162 neurons, 19 control brains, n = 185 neurons, 8 Celsr3 cKO brains). e Spatial transcriptomes of Control and Celsr3 cKO somatosensory cortex were profiled at P7, with L4 “barrel” barcode positions predicted using annotated P7 scRNA-seq data. High-probability (>0.6, red outline) L4 spots were selected, gene counts from each L4 barcode grouped by genotype, and differential gene expression was performed with DESeq2. f Heatmap displaying Z-scores for differentially regulated genes in L4 Celsr3 cKO. g Volcano plot displaying differential barrel gene expression between Celsr3 cKO versus control. Differentially regulated L4 barrel genes were determined using FDR < 0.05 and absolute Log2(cKO/control) >0.6 as cut-offs (dashed red lines) using a two-sided Wald test with Benjamini–Hochberg correction. Screened genes are annotated in (f) and (g). h ISH of candidate hollow- (left) and septa-related (right) genes in Control and Celsr3 cKO somatosensory within P7/P14 coronal sections. i Quantification of mean hollow- and septa-related expression patterns. Relative expression (LogFoldChange: cKO vs control) was averaged across the cortex for hollow and septa genes (displayed are means ± SEM of 9 hollow- and 9 septa-related genes; asterisks indicate *p < 0.05, one-sided Wilcoxon Rank Sum test, H0: µ<−0.1 or µ>0.1, multiple comparison correction using the Holm method). All scale bars, 100 µm. Source data are provided as a Source data file.

