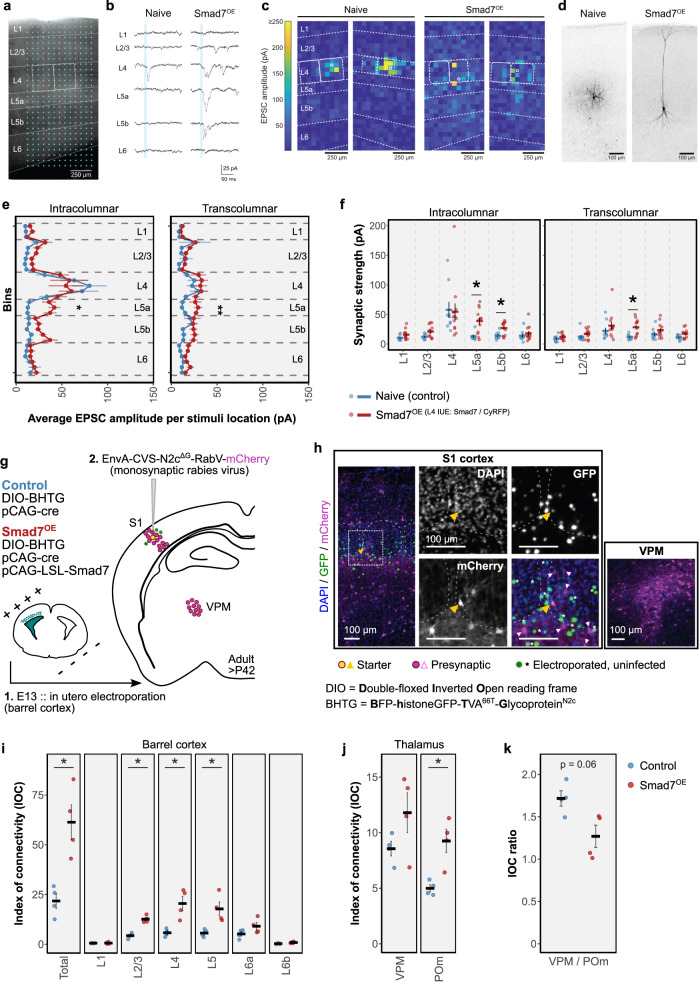
Fig. 5. Mapping input connectivity to L4 Smad7OE neurons using photostimulation glutamate-uncaging and monosynaptic rabies virus tracing.
a Differential interference contrast image of barrel cortex slice (P13-P19) showing cortical layers and patch pipette positioned in L4. Dashed lines and rectangles indicate laminar borders and L4 barrels, respectively. Blue dots indicate photostimulation sites. b EPSCs evoked in L4-barrel neurons by photostimulation at representative sites in each cortical layer (L1-L6). Blue lines indicate the period of photostimulation. EPSCs were recorded from naive (left) and Smad7OE neurons (right). c Representative heatmaps displaying the sum of EPSC amplitudes evoked in L4 neurons by photostimulation at each site. Circles indicate location of recorded neurons. d Examples of biocytin-stained L4 neurons. e Averaged EPSC amplitude per stimulation site across binned locations within the home column of recorded cells (intracolumnar, left) and outside the home column (transcolumnar, right) in naive (blue) and Smad7OE neurons (red). f Strength of synaptic inputs in each stimulus layer. In (e, f), displayed are group means ± SEM. *p < 0.05, two-sided Welch’s t test with multiple comparison correction using the Holm method (n = 9 naive neurons, n = 14 Smad7OE neurons). g Schematic illustrating rabies virus-mediated labeling of presynaptic inputs to Smad7OE neurons. L4 neurons were sparsely transfected by IUE (green circles) with Cre-dependent plasmids encoding rabies starter construct (BHTG) ± Smad7. Adult animals were injected with pseudotyped rabies virus to induce trans-synaptic labeling from starter neurons (yellow circle), with presynaptic neurons (magenta circles) labeled with mCherry. h Example of a starter neuron (yellow triangle) in L4 barrel cortex (left). Dashed box indicates area of magnified images shown on the right. Barrel outlines are indicated by dashed lines. Presynaptic neurons are indicated by magenta triangles; uninfected, electroporated neurons (green) are indicated by asterisks. Right panel, presynaptic neurons labeled in VPM thalamus. i, j Index of connectivity (IOC) for traced neurons in ipsilateral barrel cortex (i) and thalamus (j). k IOC ratio of VPM/POm thalamus. In (i–k), graphs are plotted with group means ± SEM. *p = 0.03, two-sided Wilcoxon Rank Sum test (n = 4 Control and n = 4 Smad7OE brains). Source data are provided as a Source data file.

