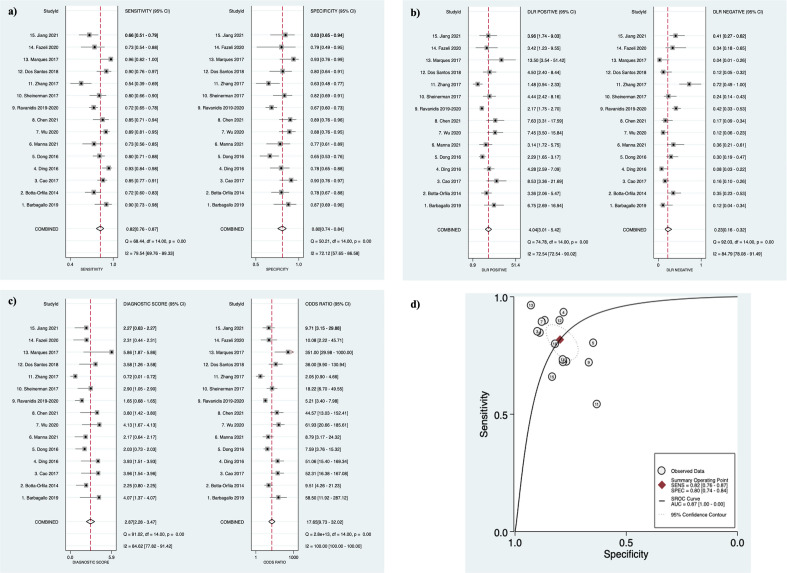
Figure 3.
Diagnostic accuracy indices for meta-analysis of the combinations of miRNAs. (a) sensitivity and specificity of biofluid-derived microRNAs with corresponding estimates for heterogeneity I2 tests (n = 15 studies). The sensitivity or specificity for each study is represented by the black circles in the grey square and the 95% confidence interval for each study is represented by the associated horizontal lines. (b) positive and negative likelihood ratios: PLR/NLR is represented by the black circles in the grey squares and the 95% confidence interval for each study is represented by the associated horizontal lines (c) diagnostic score and diagnostic odds ratio: the diagnostic score/DOR are represented by the black circles in the grey squares and the 95% confidence interval for each study is represented by the associated horizontal lines. The pooled estimate is represented by the diamonds with the horizontal edges of the diamonds reflecting the 95% confidence interval. The red dotted line represents the pooled average point estimate. The studies are ordered by biofluid type: Serum1–7, Plasma8–11, CSF12,13, PBMC14 and Saliva15. (d) Summary Receiver Operating Characteristic curve of biofluid-derived microRNAs in PD patients compared to controls (n = 15 studies). The red filled diamond represents the summary estimate of the test accuracy, and the dotted line denoting the 95% confidence region around this estimate. The circles represent each study involved in the meta-analysis: 129, 230, 331, 433, 534, 638, 743, 832, 941, 1042, 1144, 1235, 1339, 1436, 1537.

