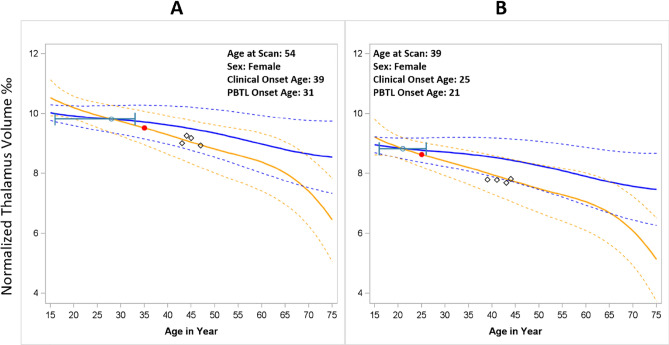
Figure 5.
Trajectory curves for earlier onset (A) versus simultaneous onset (B). Estimation of Progressive Brain Tissue Loss (PBTL) in two individuals with MS (Panels A and B). The solid yellow line represents the individual MS subjects’ thalamic volume trajectories (95% CI = dashed yellow lines). The solid blue line represents the thalamic volume trajectory for a hypothetical normal aging individual with same demographic characteritics and baseline thalamic volume as the MS patient (their digital twin). 95% CI = dashed blue lines. The point at which the MS subjects’ trajectory deviates from their digital twin is defined as the onset of PBTL, denoted with the green dot (95% CI from bootstrapping in green). The red dot denotes the age of clinical onset. Black diamonds represent MS subjects’ observed thalamic volumes over time. A High-resolution version of this Figure can be found in Supplementary Information 2.

