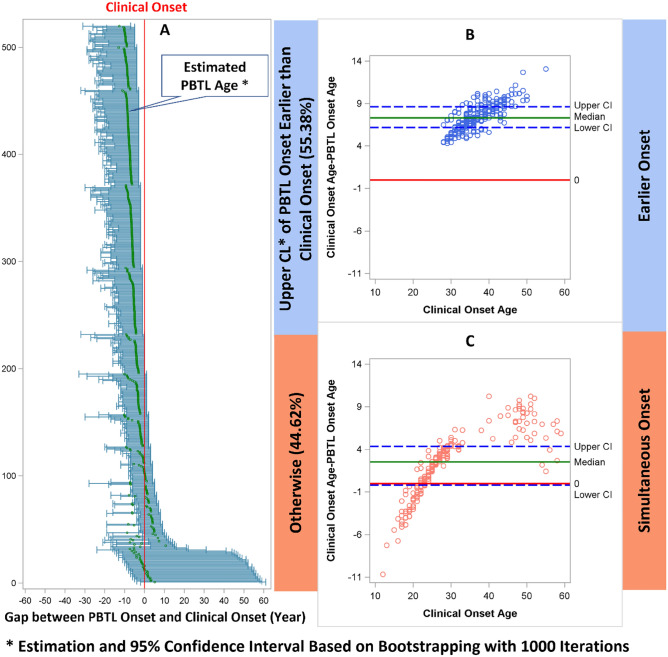
Figure 6.
Panel A: Forest plot showing PBTL onset age minus clinical onset age (in years, x axis) for each of the 519 MS patients based on 1000 bootstrapping procedure. The center vertical red line represents the 0-reference line (clinical onset age). The tick marks in each horizontal line include the mean and 95% confidence interval. If the upper limit of 95% CI on the left of the center line, it suggests earlier onset. Otherwise, if the 95% CI includes the center line, it suggests simultaneous onset. Panels B and C: Bland–Altman plots. Each dot represents the difference between the age of onset of PBTL and the age of clinical onset. If the lower bound of 95% CI for the difference goes below the 0-reference line (red), it indicates weak evidence that the age of onset of progressive brain tissue loss is younger than the age of clinical onset. None of the dots are below the reference line in Panel B but they are in Panel C, consistent with our classification of “early” vs “simultaneous” onset. A High-resolution version of this Figure can be found in Supplementary Information 2.

