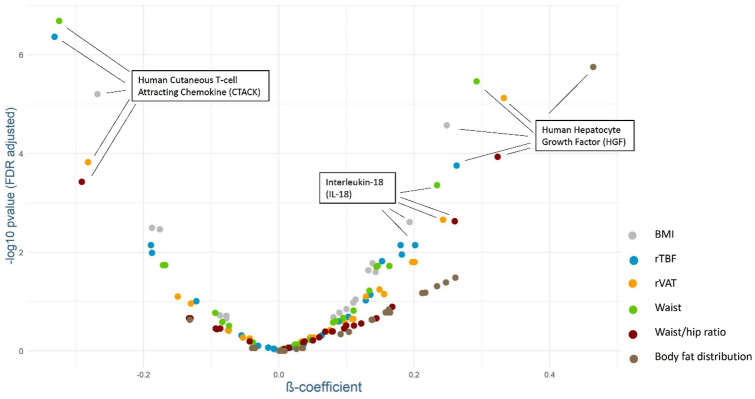
Fig. 4.
Associations between anthropometric parameters and serum cytokine concentrations. The Linear regression models were adjusted for sex, age, education, smoking status, alcohol consumption, hypothyroidism and corresponding visit (baseline, follow-up). Both, the exposure variables and the outcome were standardized. The figure displays the estimated β-coefficients (X-axis) and the − log10 transformed FDR-adjusted p values (Y-axis)

