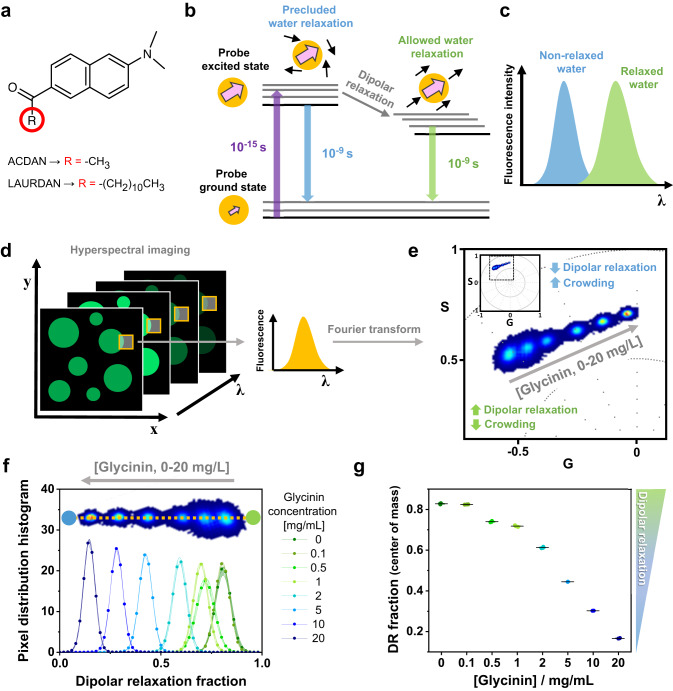
Fig. 1. DAN probes solvatochromism allows the quantification of water dipolar relaxation and crowding.
a Molecular structure of the di-methylaminonaphtalene (DAN) probes, highlighting the differences between ACDAN (6-acetyl-2-dimethylaminonaphthalene, water soluble) and LAURDAN (6-dodecanoyl-2-dimethylaminonaphthalene, partitions in membranes). b Perrin-Jablonski diagram illustrating the phenomenon of solvent dipolar relaxation. Upon excitation, there is an increase in the dipole moment of the probe (pink arrow). When the solvent dipoles (black arrows) are free to align with the probe in its excited state, the dipole energy is reduced and the fluorescence emission is red-shifted, as seen in (c). d Hyperspectral imaging consists of acquiring images at different emission wavelengths to generate a lambda-stack. Each pixel of the final image contains spectral information. e Phasor plot of the spectral emission of ACDAN in solutions containing glycinin. The data for different protein concentrations in water (0, 0.1, 0.5, 1, 2, 5, 10 and 20 mg/mL) are superimposed. Increasing the protein-water ratio results in a blue-shift of the emission, i.e. a decrease in water dipolar relaxation. The inset shows the full spectral phasor plot and the dashed square delineates the fragment that is magnified in the graph. The colors of the pixel clouds indicate the pixel density, increasing from blue to red. f Dipolar relaxation fraction histogram from two-cursor analysis for the data shown in (e). Data are represented as the mean (dots and lines) ± SD (shadowed contour), n = 3 independent experiments per condition. The inset shows the trajectory displayed by the pixel clouds taken from the phasor plot, from which the histograms were calculated. g The center of mass of the histograms for the dipolar relaxation fraction shown in (f) is represented as mean ± SD (see Eq. 12), and independent experiments are plotted. Data for panels (f) and (g) are provided as a Source Data file.

