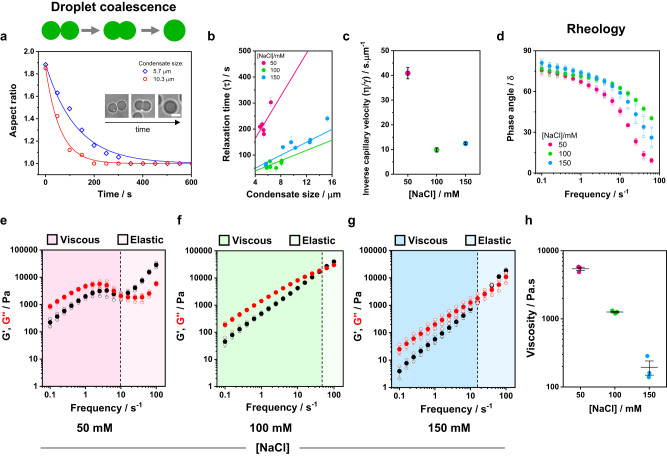
Fig. 4. Glycinin condensates material properties change with salinity.
The material properties of condensates at 50 mM (pink), 100 mM (green) and 150 mM (blue) NaCl were evaluated with different approaches. a Examples of aspect ratio vs time for coalescing condensates of different sizes. Glycinin condensates coalesce within minutes, displaying different characteristic relaxation times according to size and NaCl concentration. The data are fitted with the function , where is the characteristic relaxation time. The inset shows an example of condensate coalescence at 100 mM NaCl. The scale bar is 5 µm. b Plot of the relaxation time vs. the final condensate diameter. Values are shown as mean ± SD, n = 19 independent experiments. Solid lines are fits to the linear equation: , where the slope, , is the inverse capillary velocity. c Inverse capillary velocity obtained from (b) for varying salt concentrations indicate that the material properties of the condensates are modulated by salinity conditions. The data plotted correspond to mean ± SD values of the slopes of the curves shown in (b). d–h Rheology measurements of glycinin condensates at different salt concentrations display changes in the material properties. d. Phase angle vs frequency for glycinin condensates at the different conditions. In all cases condensates behave as viscoelastic liquids (see Supplementary Fig. 6). Independent experiments are plotted as open circles and the mean ± SD are shown in solid circles (n = 3). e–g Plots showing the average storage and loss modulus (, black, and , red) vs frequency for glycinin condensates at the indicated salinities. Independent measurements are plotted as hollow circles and the mean ± SD are shown in full circles (n = 3). Shaded regions represent the the dominant viscous or elastic regime, as indicated. The crossover frequency (black dashed line) is equal to , where is the terminal relaxation time. h Zero-shear viscosity for the condensate phase at different salt concentrations. Independent measurements are shown as circles, and lines represent mean values ± SD. Data for panels (a–h) are provided as a Source Data file.

