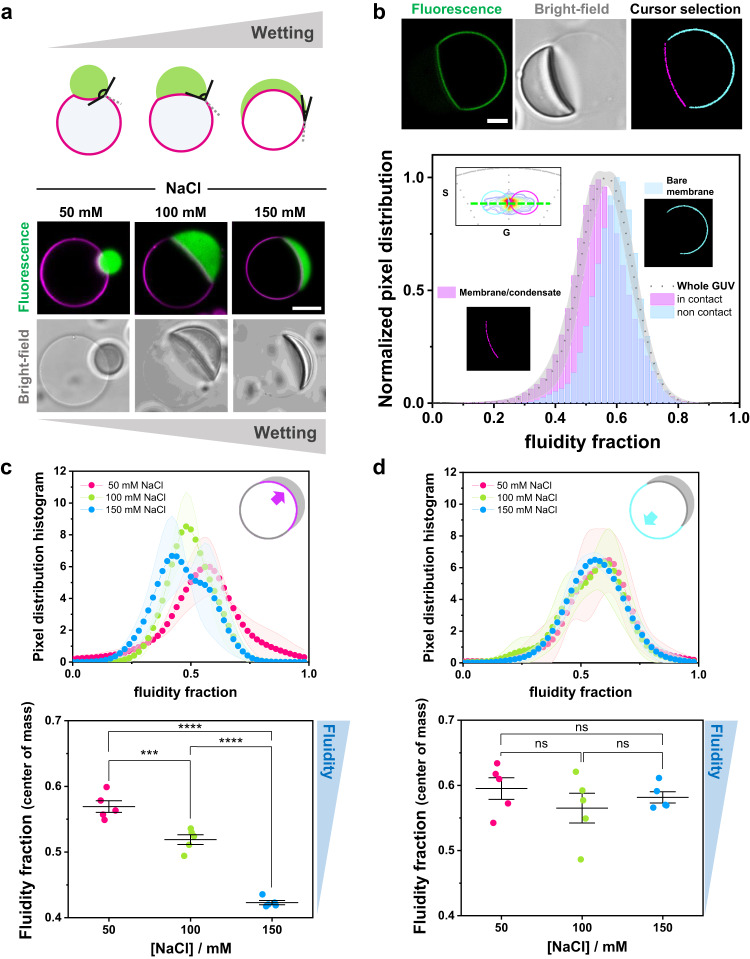
Fig. 6. Membrane wetting by condensates increases lipid packing and membrane dehydration.
a Biomolecular condensates can wet membranes23,28, and the increase in wetting can be observed as an increase in the spreading of the droplet over the membrane, as well as a decrease in the contact angle as illustrated in the sketch (upper panel). Examples of membrane wetting (DOPC GUVs labeled with 0.1 mol% Atto 647N-DOPE, magenta) by glycinin condensates (FITC labeled, green) at the indicated NaCl concentrations (bottom panel). Scale bar: 10 µm. b–d DOPC GUVs labeled with LAURDAN (0.5 mol%) in contact with unlabeled condensates.Using LAURDAN fluorescence spectral phasor analysis, we can segment the vesicle and separate the contributions of the membrane in contact with the condensate and the bare membrane on the same GUV. b Example analysis for a single DOPC GUV labeled with 0.5% LAURDAN (green) in contact with an unlabeled condensate (at 100 mM NaCl). The cursor-colored segments and the corresponding histograms are shown in the bottom panel. The part of the membrane in contact with the condensate is more packed (with lower fluidity fraction) than the bare membrane. Distributions were normalized for clarity. Scale bar: 10 µm. c, d Histograms of the pixel distribution (top panel), and center of mass of the distributions (bottom panel) for the membrane segment in contact with the condensate (c) and for the bare membrane segment (d), at the indicated NaCl concentrations. The sketches indicate the part of the membrane being analyzed. Data are shown as mean ± SD (n = 5 GUVs per condition). The statistical analysis was performed with One-way ANOVA and Tukey post-test analysis (p < 0.0001, **** | p < 0.001, *** | p < 0.01, ** | p < 0.05, * | ns = non-significant). Data for panels (b–d) are provided as a Source Data file.

