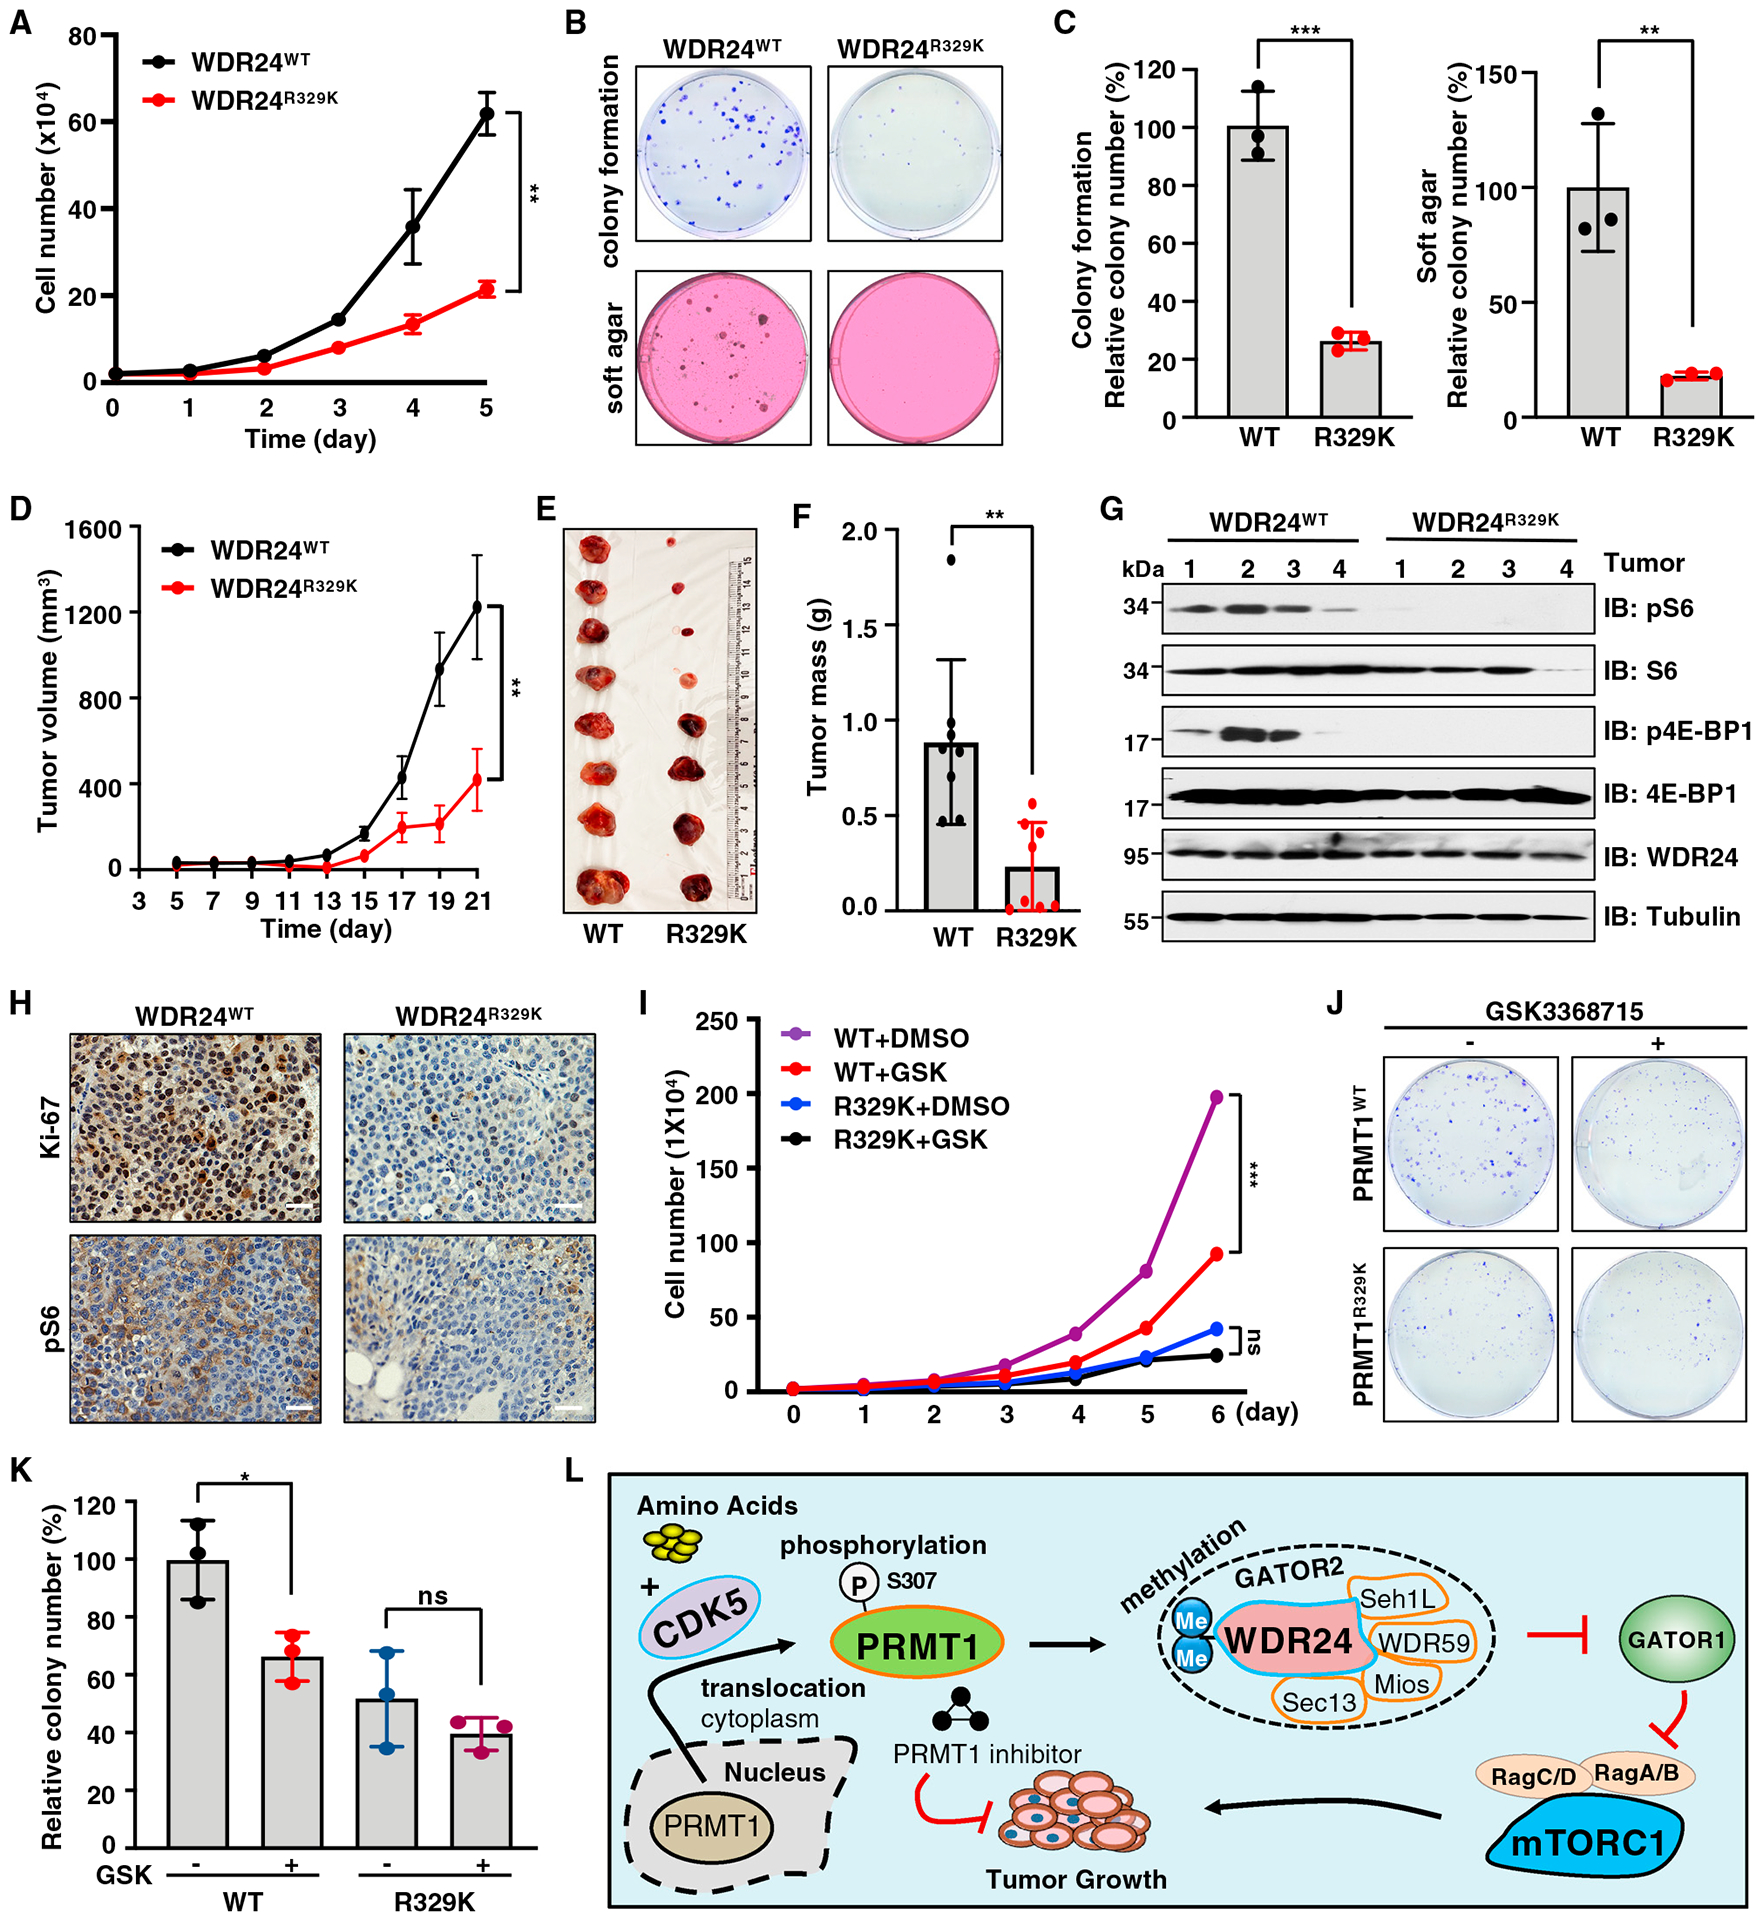
Figure 7. Deficiency in WDR24-R329 methylation suppresses cell proliferation and xenograft tumor growth.

(A) WDR24WT and WDR24R329K knockin Huh7 cells were subjected to cell proliferation assays. Data are shown as mean ± SD of n = 3 independent experiments. **p < 0.01, two-way ANOVA.
(B and C) WDR24WT and WDR24R329K knockin Huh7 cells were subjected to colony formation and soft agar assays. Representative images are shown in (B) and quantification of colonies in (C). Data are shown as the mean ± SD of n = 3 independent experiments. **p < 0.01, ***p < 0.001, two-tailed Student’s t test.
(D) WDR24WT and WDR24R329K knockin Huh7 cells were subjected to mouse xenograft assays. Tumor growth was monitored. Data are shown as mean ± SEM of n = 8 tumors for each group. **p < 0.01, two-way ANOVA.
(E and F) Dissected tumors were weighed. Data are shown as the mean ± SD of n = 8 tumors for each group. **p < 0.01, two-tailed Student’s t test.
(G) IB analysis of lysates derived from tumor tissues in (E).
(H) IHC staining of Ki-67 and pS6 in tumor tissues. Scale bar, 50 μm.
(I) WDR24WT and WDR24R329K knockin Huh7 cells were treated with GSK3368715 and subjected to cell proliferation assays. Data are shown as mean ± SD of n = 3 independent experiments. ***p < 0.001, two-way ANOVA. ns, non-significant.
(J and K) WDR24WT and WDR24R329K knockin Huh7 cells were treated with GSK3368715 and subjected to colony-formation assays. Representative images are shown in (J) and quantification of colonies in (K). Data are shown as mean ± SD of n = 3 independent experiments. *p < 0.05, two-tailed Student’s t test. ns, nonsignificant.
(L) A model depicting the detailed molecular mechanism underlying the critical role of CDK5-PRMT1-WDR24 signaling axis in regulation of mTORC1 pathway activation and tumor growth.
