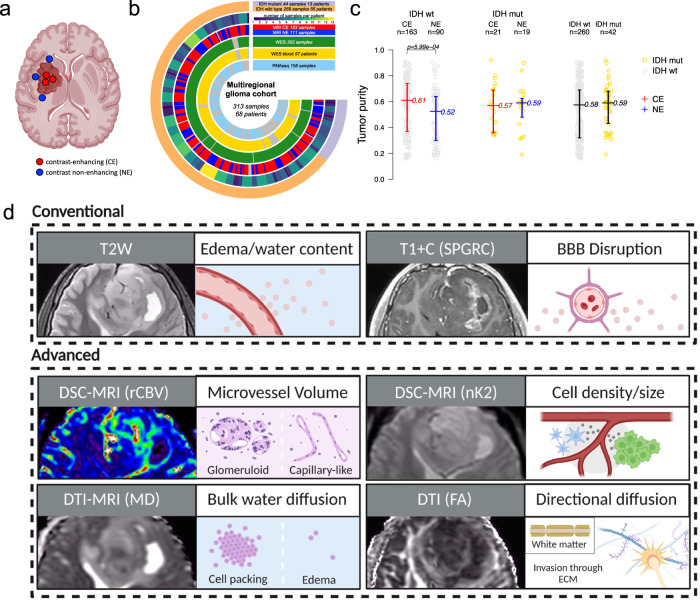
Fig. 1. Multiregional biopsy and MRI-based tumor sampling from a cohort of glioma patients.
a MRI contrast enhancement-based sampling of glioma specimens. b Circos plot indicating the molecular assay and MRI annotation of multiregional samples. c Tumor purity has been inferred from WES (available for 302 samples) and compared between contrast-enhancing (CE) and contrast non-enhancing (NE) samples within IDH wild-type group (left; MRI annotated IDH wild-type samples = 253), within IDH-mutant group (middle; MRI annotated IDH-mutant samples = 40), and between IDH wild-type and IDH-mutant samples (right). The middle line corresponds to the median; the lower and upper lines show the first and third quartiles. Difference of the purity mean among groups was assessed using the two-sided Mann–Whitney–Wilcox test. Source data are provided as a Source data file. d Schematic of imaging features extracted for this study and their phenotypic correlates. Features are separated into conventional and advanced MRI features.

