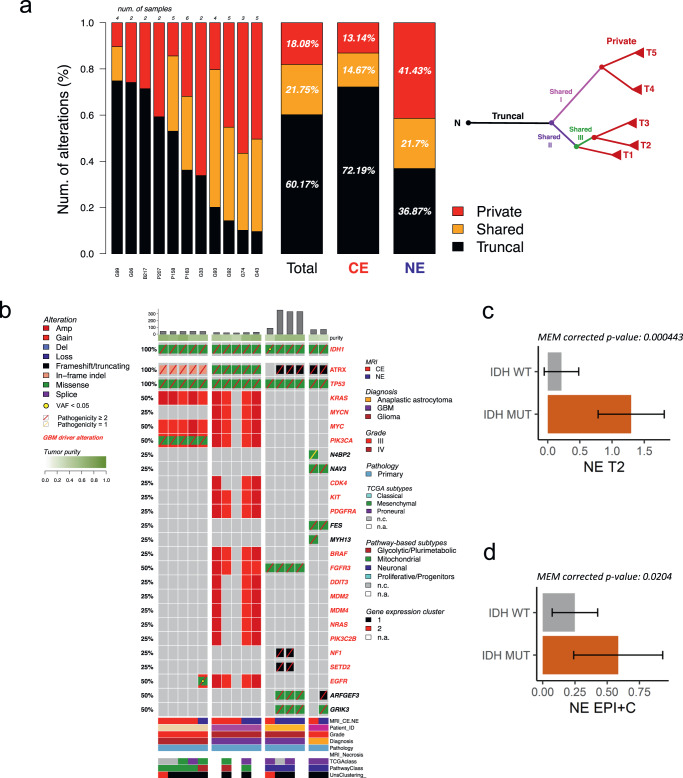
Fig. 2. Somatic genetic mutations, copy number alterations, and correlates of imaging features in IDH-mutant glioma.
a For each IDH-mutant tumor (listed on horizontal axis), genetic variants have been annotated as private (exclusively occurring in one sample), shared (occurring in two or more samples, but not in all samples) and truncal (occurring in all samples) and reported as a percentage of the total number of somatic variations. The proportion of mutation types was significantly different between CE and NE (two-sided Fisher’s exact test p = 3.43e−67). A schematic example of multiregional tumor evolution is represented as a tree in which truncal, shared, and private branches are distinguished. b Overview of somatic alterations in IDH-mutant samples grouped by patient. Mutation load and tumor purity are reported in the top barplot and heatmap track, respectively. Clinical annotation and gene expression classification are indicated in the bottom tracks. Gene alteration frequency in the patient cohort is indicated as percentage on the left, known with driver mutations highlighted in red. c MEM model derived estimated marginal mean of T2W in IDH-mutant vs. IDH wild-type samples in the NE. Error bars show 95% confidence interval. Two-sided t-test with Tukey correction (n = 86). d MEM model derived estimated marginal mean of EPI + C in IDH-mutant vs. IDH wild-type samples in the NE. Error bars show 95% confidence interval. Two-sided t-test with Tukey correction (n = 89). c, d Data are presented as mean values +/−SD. a, c, d Source data are provided as a Source data file.

