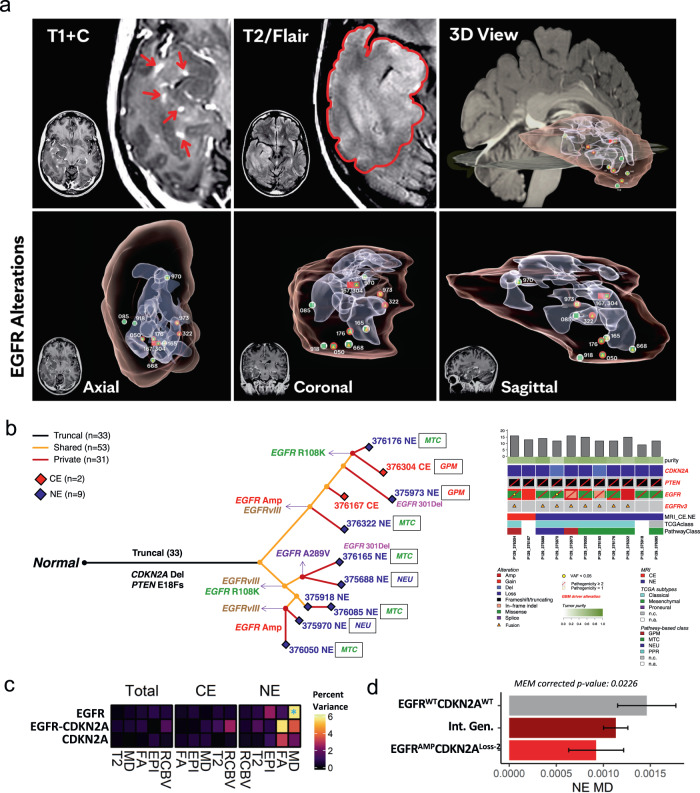
Fig. 5. Spatial heterogeneity of EGFR alteration and EGFR-associated imaging phenotypes.
a Three-dimensional visualization of EGFR alterations and their associated MRI features. b The molecular evolution of glioblastoma from patient P129 inferred from the occurrence of genetic alterations as truncal, shared, and private events across the multiregional specimens (n = 11, 2 contrast-enhancing and 9 contrast non-enhancing samples). The length of branches in the evolutionary tree (left panel) is proportional to the number of occurring alterations. Truncal driver alterations (CDKN2A deletion and PTEN frameshift mutation), and non-truncal multiple EGFR alterations have been reported along the evolutionary tree and in the oncoprint (right panel). Mutation load, tumor purity, MRI contrast enhancement annotation, and gene expression classification have been reported. c The percent variance attributed to each fixed term (y-axis) in MEMs for each imaging variable (x-axis) separated by region. *p-value < 0.05. EGFR*CDKN2A indicates the interaction of EGFR and CDKN2A (n = 221 biopsy samples). Statistical test: ANOVA. d MEM model derived estimated marginal mean of MD for EGFR and CDKN2A genotypes in the NE. Intermediate genotypes (Int. Gen.) denote genotypes that are not double wild type or EGFR amplified and CDKN2A homozygous loss. Error bars show 95% confidence interval (n = 74 biopsy samples). Statistical test: two-sided t-test with Tukey correction. Data are presented as mean values +/−SD. c, d Source data are provided as a Source data file.

