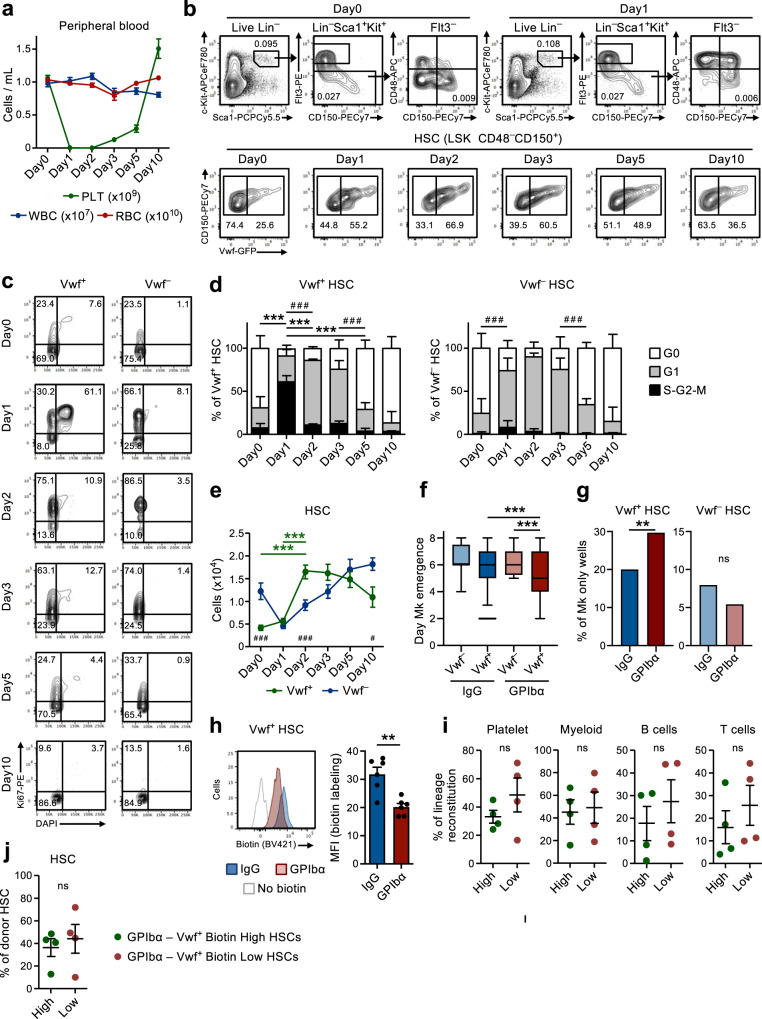
Fig. 1. Rapid activation of Vwf+ HSCs in response to acute platelet depletion precedes restoration of platelet homeostasis.
(Related to Supplementary Figs. 1 and 2). a Kinetics analysis of peripheral blood cell parameters post administration of anti-GPIbα antibody. Day 0 mice were treated with IgG isotype control antibody. Data represent mean ± SEM of 10 (Day0), 13 (Day1), 10 (Day2), 9 (Day3), 8 (Day5) and 7 (Day10) mice from 14 independent experiments. PLT platelets, WBC white blood cells, RBC red blood cells. b Representative FACS profiles and gating strategy of Vwf-GFP+ (Vwf+) and Vwf-GFP– (Vwf–) LSKFlt3–CD150+CD48– HSCs at the indicated time points after platelet depletion. Numbers in gates/quadrants indicate the frequency (average of all mice analyzed) of the gated cell population among total live cells (upper panels) or among HSCs (lower panels). c, d Cell cycle analysis of Vwf+ and Vwf– LSKFlt3–CD150+CD48– HSCs at the indicated time points post platelet depletion. c Representative cell cycle FACS profiles of Vwf+ (left) and Vwf– (right) HSCs in G0 (DAPI–Ki67–) G1 (DAPI–Ki67+) or S-G2-M (DAPI+Ki67+) phases of cell cycle. Numbers in gates represent frequencies (average of all mice analyzed) of total HSCs. d Mean ± SD cell cycle phase distribution of Vwf+ (left) and Vwf– (right) HSCs. Data from 5 (Day0), 5 (Day1), 3 (Day2), 5 (Day3), 5 (Day5) and 4 (Day10) mice from 6 independent experiments. ***p < 0.001; **p < 0.01 for the S-G2-M cell cycle fraction; # # #p < 0.001 for the G1 cell cycle fraction (both using 2-way ANOVA with Tukey’s multiple comparisons); e Absolute numbers of Vwf+ and Vwf– HSCs (per 2 legs, see methods). Mean ± SEM data of 8 (Day0), 8 (Day1), 7 (Day2), 5 (Day3), 6 (Day5) and 5 (Day10) mice from 9 independent experiments. ***p < 0.001 for Vwf+ HSC (2-way ANOVA with Tukey’s multiple comparisons); #p < 0.05 and ###p < 0.001 for the comparison of Vwf+ vs. Vwf– HSCs (2-way ANOVA with Sidak’s multiple comparisons). Time of appearance of the first Mk (f) and frequency of colonies with only Mk cells (g) in cultured single Vwf–or Vwf+ HSCs isolated from mice 16 hrs post IgG or GPIbα treatment. Data from 138, 364, 147 and 451 single cell-derived colonies analyzed, respectively, from 5 biological replicates in 4 independent experiments. f Middle line represents median, box limits represent the 25–75 percentiles, whiskers mark the 5–95 percentiles. Cells outside the 5–95 percentiles are marked as outliers. P values calculated with Kruskal–Wallis test with Dunn’s multiple comparisons. g P value calculated with two-sided Fisher’s exact test. ***p < 0.001; **p < 0.01; *p < 0.05; ns, non-significant (p > 0.05). h Biotin proliferation analysis of Vwf-GFP+ HSCs 2 days post IgG or GPIbα treatment. Representative plot (left) and mean ± SD MFI (normalized for MFI of No biotin labeling control; right) from 6 mice per group in 3 independent experiments. **p < 0.01; calculated with two-sided t-test. Long-term reconstitution (16 weeks) of platelet, myeloid and lymphoid cell lineages in blood (i) and of the BM HSC compartment (j) by biotin high and biotin low Vwf-GFP+ HSC fractions 2 days post platelet depletion. 50 cells transplanted per mouse. Data represent mean ± SEM of 4 donors in 2 independent experiments. Each dot represents the mean of 2 recipient mice transplanted per donor. ns, non-significant (p > 0.05); calculated with two-sided t-tests. See also Supplementary Figs. 1 and 2.

