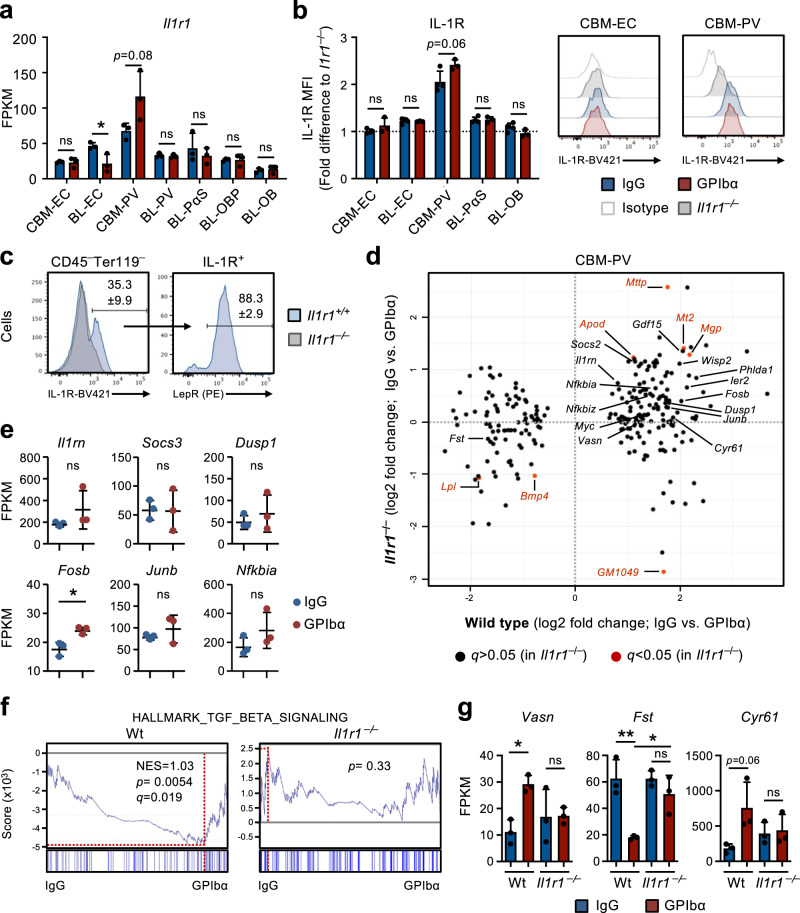
Fig. 4. IL1R expression defines a population of perivascular bone marrow stromal cells implicated in the HSC response to platelet depletion.
a RNA-sequencing analysis of Il1r1 gene expression (FPKM) in different niche cells isolated from mice in homeostasis (IgG treated) or 1 day post platelet depletion (GPIbα treated). Mean ± SD FPKM data of 3 biological replicates from 2 independent experiments. b, c Flow cytometric analysis of IL-1R expression in different endothelial/stromal cell populations isolated from mice in homeostasis or 1 day post platelet depletion. Mean ± SD data of Mean fluorescence intensity (MFI) normalized to the MFI of the equivalent cell population in Il1r1–/– mice analyzed within the same experiment (b). c Frequency of Lepr+ PV cells in total IL-1R+ CBM non-hematopoietic cells isolated from mice in homeostasis. Data from 4 (IgG) and 3 (GPIbα) mice in 2 independent experiments. d RNA-sequencing analysis of CBM-PV cells isolated from Il1r1+/+ and Il1r1–/– mice in homeostasis and after platelet depletion, for the expression of CBM-PV-GPIbα treatment responsive genes. Data from 3 biological replicates per condition. e Expression of IL-1 signaling pathway affiliated genes in CBM-PV cells isolated from Il1r1–/– mice 1 day post platelet depletion. Mean ± SD FPKM data of 3 biological replicates per condition. GSEA of global gene expression data for the indicated gene set (f) and expression (FPKM; Mean ± SD) of the indicated genes (g), in CBM-PV cells from wild type and Il1r1–/– mice in homeostasis and after platelet depletion. Data from 3 mice per condition. NES, normalized enrichment score (or scaled score). *p < 0.05; **p < 0.01; ns, non-significant (p > 0.05); using two-sided t-test (a, b, e) and 2-way ANOVA with Tukey’a multiple comparisons (g).

