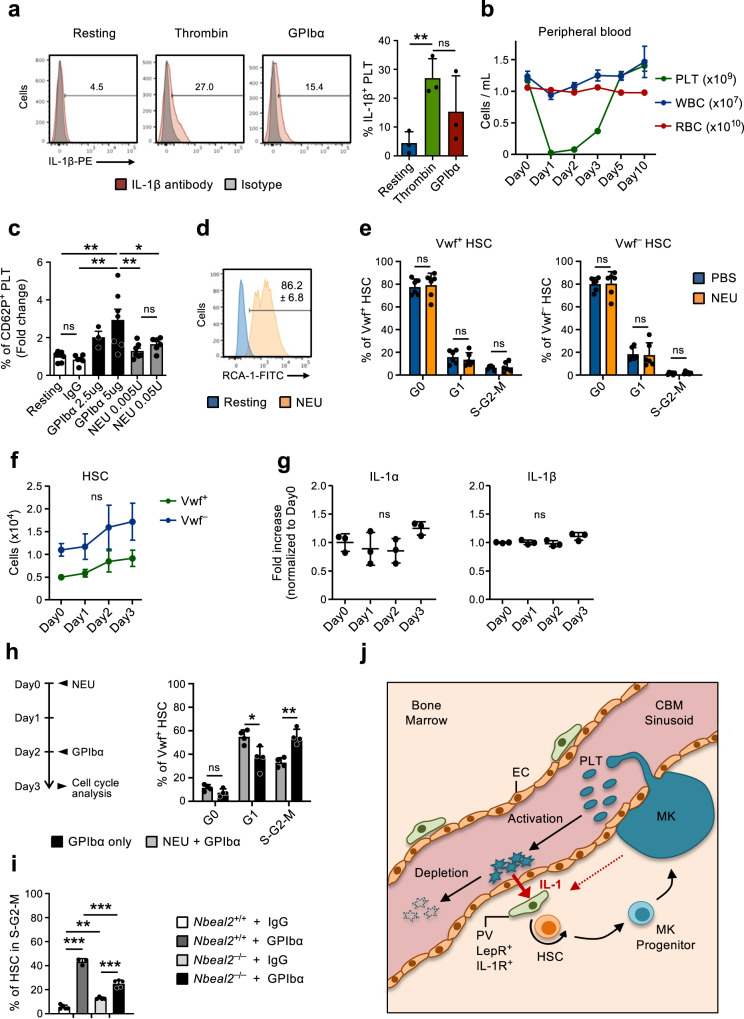
Fig. 6. Neuraminidase-mediated platelet depletion does not activate HSCs.
(Related to Supplementary Fig. 4). a Expression of IL-1β in platelets resting or after in vitro activation (3hrs) with thrombin or GPIbα antibody. (Left), representative FACS profiles. Numbers in plots are average frequencies from 3 independent experiments. (Right) Frequency of IL-1β+ platelets; mean ± SD of 3 biological replicates per condition in 3 independent experiments. Each biological replicate consists of platelets pooled from 2-3 mice. b Kinetics analysis of peripheral blood cell lineages following in vivo Neuraminidase (NEU) administration. Data represent mean ± SEM of 10 (Day0), 7 (Day1), 8 (Day2), 9 (Day3), 6 (Day5) and 3 (Day10) mice from 6 independent experiments. PLT platelets, WBC white blood cells, RBC red blood cells. c Expression of surface P-selectin (CD62P) on platelets measured by flow cytometry after in vitro incubation with GPIbα antibody or NEU, at the indicated concentrations. Data represent mean ± SD fold changes of % CD62P+ cells in each condition in relation to untreated (resting) platelets, of 7 (Resting), 6 (IgG), 3 (GPIbα-2,5ug), 7 (GPIbα-5ug), 7 (NEU 0.005U) and 6 (NEU 0.05U) mice in 3 independent experiments. d In vitro neuraminidase (NEU) activity in resting platelets or after 30 min treatment with NEU, analyzed by RCA-1 binding. Representative profile from 1 out of 3 biological replicates. Numbers indicate mean ± SD % RCA-1+ platelets. e Mean ± SD cell cycle phase distribution of Vwf+ (left) and Vwf– (right) HSCs 1 day post platelet depletion with NEU. Data from 6 mice per condition, in 3 independent experiments. f FACS-based assessment of the HSC compartment in bone marrow of mice at the indicated time points after platelet depletion with NEU. Data represent absolute numbers of Vwf-GFP+ (Vwf+) or Vwf-GFP– (Vwf–) HSCs (average ±SEM) at the indicated time points after platelet depletion. Data are from 5 (Day0), 4 (Day1), 5 (Day2) and 6 (Day3) mice in 4 independent experiments. No significant changes were observed in numbers of Vwf+ or Vwf– HSCs at any time point. g Mean ± SD levels (fold-increase relative to Day0) of the indicated cytokines in bone marrow extracellular fluid isolated from mice at the indicated time points post platelet depletion with Neuraminidase. Data from 3 mice per time point in 2 independent experiments. h Mice were treated with NEU at day 0, followed by GPIbα antibody administration at day 2 and analyzed at day 3 (left) for cell cycle phase distribution in Vwf+ HSCs (right). Control mice were treated only with GPIbα antibody and analyzed 1 day later. Data represent mean ± SD frequencies of 4 mice per group in 2 independent experiments. i HSCs in S-G2-M in Nbeal2–/– mice 1 day post platelet depletion (GPIbα). Data represent mean ± SD cell frequencies of 5 (Wt-IgG), 3 (Wt-GPIbα), 4 (Nbeal2–/–-IgG) and 5 (Nbeal2–/–-GPIbα) mice per condition from 3 independent experiments. j Scheme depicting the feedback mechanism proposed. While being consumed activated platelets secrete IL-1, which activates IL-1R expressing PV cells to induce HSC proliferation and differentiation toward the platelet lineage. As indicated, Mks may also contribute to the described recruitment of HSCs into proliferation in response to treatment with the anti-GPIbα antibody resulting in activation-dependent platelet depletion. For all data ***p < 0.001; **p < 0.01; *p < 0.05 (Only indicated for significant differences) using 1-way ANOVA with Tukey’s multiple comparisons (a, c, f, i), 2-way ANOVA with Sidak’s multiple comparisons (e, h) or Dunnett’s multiple comparisons (g); ns non-significant. See also Supplementary Fig. 6.

